


 Mastering IG Reel Ads A Complete Guide
When people talk about brand awareness KPIs, they're really talking about the specific, measurable numbers you use to see how familiar and recognizable your brand is to the right people. Think of them as data points that turn a fuzzy idea into something you can actually track and improve, covering everything from website traffic to how people are talking about you on social media.
Table of Contents
Why Tracking Brand Awareness Is Non-Negotiable
It's tempting to think of brand awareness as a "soft" or fluffy goal. But that's a huge mistake. In reality, it’s the absolute bedrock of long-term, sustainable growth.
Trying to drive sales without first building brand recognition is like an architect trying to build a skyscraper on an unpaved lot. Sure, you might get a structure up, but it has no solid foundation. It's not built to last, and it definitely can't withstand any real pressure.
This is exactly why specific brand awareness KPIs are so critical. They pull your strategy out of the realm of guesswork and ground it in a data-driven approach. With the right metrics, you can:
- Allocate Budgets Intelligently: Justify your marketing spend by showing a clear link between your awareness campaigns and audience growth.
- Outmaneuver Competitors: Get a real sense of your position in the market and spot opportunities to own a bigger piece of the conversation.
- Achieve Sustainable Growth: Build a loyal audience that actively looks for your brand, which translates into more predictable, reliable revenue.
Brand awareness isn't just about getting seen; it's about being remembered and, ultimately, being chosen. It’s the sum total of every interaction someone has with you, creating a mental shortcut that puts your brand first when it's time to make a purchase.
To get a handle on this, it helps to group the different metrics into categories.
Core Brand Awareness KPI Categories
Here’s a quick overview of the main types of brand awareness metrics and what they're designed to measure.
| KPI Category | What It Measures | Example Metric |
|---|---|---|
| Reach | The raw number of people exposed to your brand. | Impressions |
| Engagement | How your audience interacts with your content. | Social Media Shares |
| Brand Presence | How often your brand is mentioned or sought out. | Share of Voice |
These categories provide a solid framework for understanding how different metrics work together to paint a complete picture of your brand's standing.
The Core Pillars of Brand Awareness KPIs
So, how do you actually measure brand awareness effectively? You need a framework. The infographic below breaks down the key performance indicators into three main buckets, which we'll dive into throughout this guide.
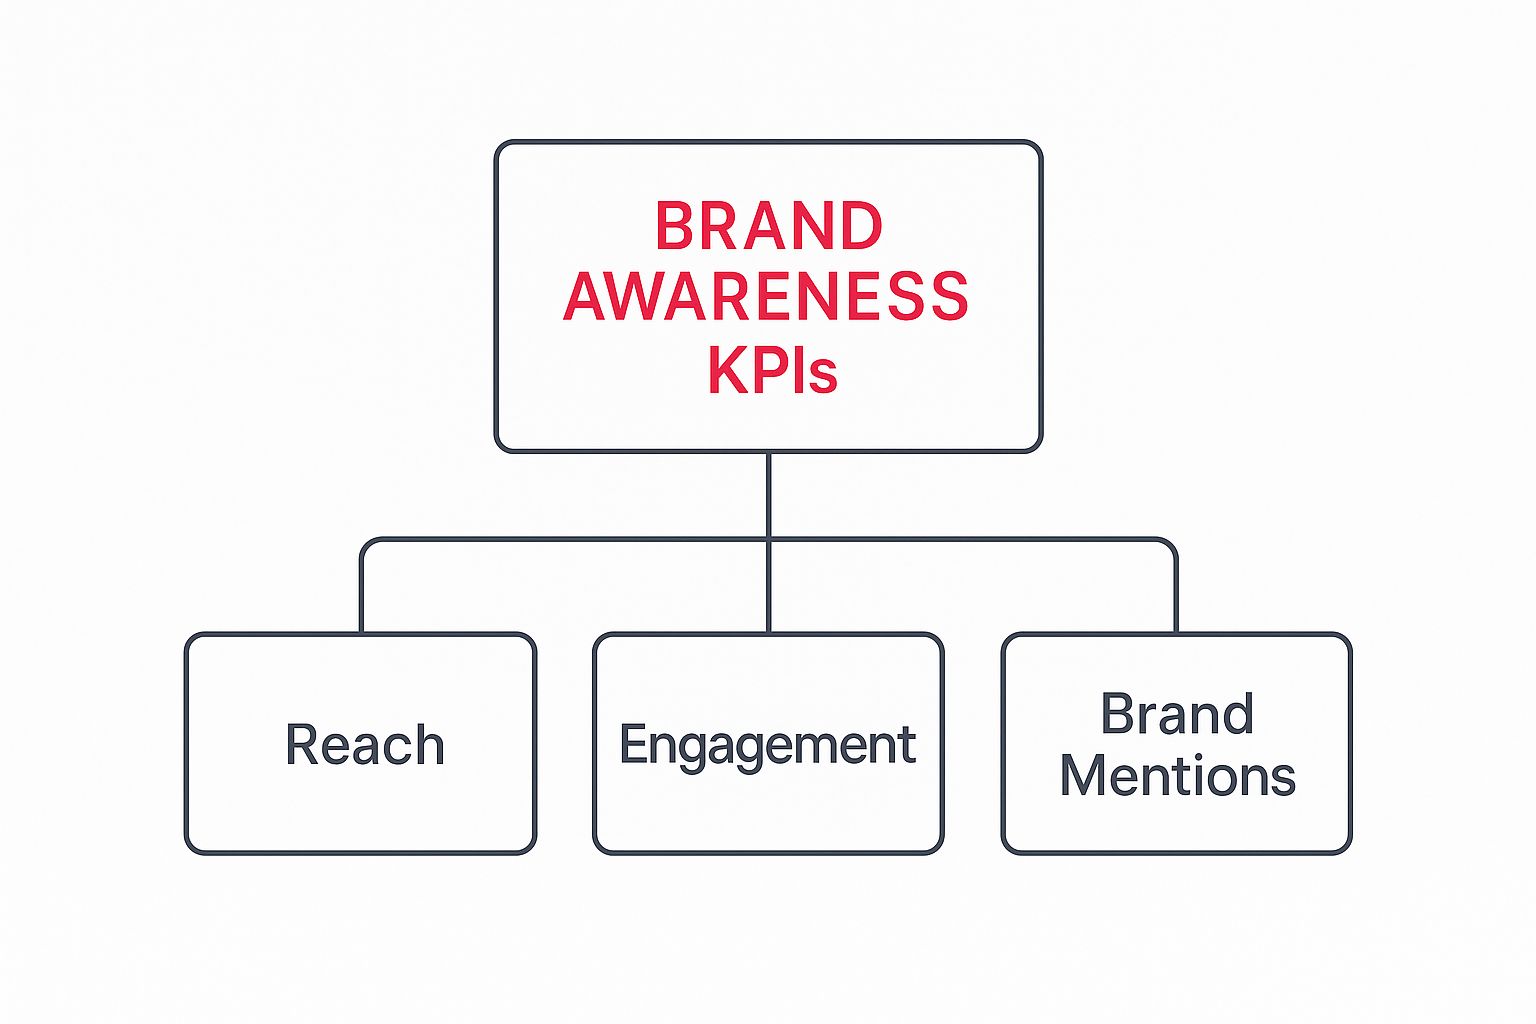
This structure makes it clear that true awareness isn't just about one thing. It's a powerful mix of how many people you reach, how they engage with what you put out there, and how often they talk about you on their own.
The ultimate goal is to connect these top-of-funnel metrics to bottom-line results. For example, full-funnel studies have shown that when brand awareness KPIs like video views and social media share of voice climb by 15-20%, companies often see a related revenue increase of 5-10% in the next quarter. You can read more about how brand awareness impacts revenue in this great piece from PAN Communications.
By tracking the right KPIs, you build a powerful, undeniable case for brand investment that will resonate with any C-suite.
Analyzing Your Digital Presence and Search Impact

To really get a feel for how well-known your brand is, you have to look at how people actually find you online. A handful of core brand awareness KPIs tell this story perfectly. They show whether your audience is actively looking for you or just stumbling across your content by chance.
Think of these metrics as digital breadcrumbs. They lead right back to your marketing efforts, painting a clear picture of what’s hitting the mark and what’s falling flat.
Tracking Intent with Branded Search
The first, and arguably most telling, of these metrics is Direct Traffic. Picture a customer confidently walking straight into your store because they already know your name and trust what you offer. They aren’t asking a search engine for directions or clicking a link from another site. They’re typing your URL directly into their browser.
This is the ultimate sign of strong brand recall. It means you’ve earned a spot in your audience’s mind. You can easily track this in Google Analytics by going to Acquisition > Traffic acquisition and filtering for the "Direct" session default channel group.
Direct traffic isn't just a number; it's a testament to your brand's top-of-mind awareness. A consistent increase here means your brand-building activities are successfully creating an audience that seeks you out intentionally.
While direct traffic shows recall, another key metric reveals active interest: Branded Search Volume. This measures how many people are punching your brand name (or variations of it) into search engines like Google.
It’s the online equivalent of hearing your name pop up in more and more conversations. It’s a sure sign that your brand is becoming a known entity that people are curious about. A tool like Google Search Console is your best friend here, as it shows you the exact search queries people use to land on your site.
These two KPIs—direct traffic and branded search—are gold because they prove users are intentionally seeking you out. For example, a brand seeing a steady 10-15% year-over-year lift in direct traffic is a great indicator of growing familiarity. Likewise, a 30% jump in branded search volume over six months usually points to a successful marketing campaign and a much stronger market presence. You can explore more ways to measure this kind of growth at Venturz.co.
Measuring Digital Word of Mouth
Finally, we have Referral Traffic, which is basically digital word-of-mouth. When another credible website links to you, they're giving you a public vote of confidence.
This not only sends interested people your way but also signals to users and search engines alike that your brand is a trusted voice in your field.
You can keep an eye on your top referring domains in Google Analytics to see which sites are sending you the most valuable traffic. When you look at these three KPIs together—Direct, Branded Search, and Referral—you get a full-circle view of your digital footprint. You move beyond simple vanity metrics to see how deeply your brand is truly connecting with your audience.
Measuring Your Social Footprint and Share of Voice
While website traffic tells one side of the story, your brand’s social media presence reveals how it really lands in public conversations. To get the full picture, you have to look past vanity numbers like follower counts. The most powerful brand awareness KPIs on social media dig into genuine audience connection and where you stand against the competition.
The first, and most crucial, metric is Engagement Rate. This KPI is a bundle of likes, comments, and shares, and it basically measures the pulse of your content. A high engagement rate is gold. It shows your audience isn’t just scrolling past your posts; they’re actually interacting, which is a massive signal of a strong brand connection.
Of course, it's not just about numbers. The quality of your social presence matters, too. For example, knowing how to handle things like dealing with inconsistent social media branding can make or break how people perceive your social footprint.
Understanding Your Share of Voice
While engagement tracks your connection with your own followers, Share of Voice (SoV) zooms out to see how you stack up against everyone else. Think of your industry as a loud, crowded party. Share of Voice tells you how much of the chatter is about your brand versus all the other brands shouting for attention.
It’s a direct, no-fluff measure of your visibility in the market. A higher SoV means your brand is grabbing more of the spotlight, building authority, and becoming a dominant player in your field. For competitive analysis, it's one of the most insightful brand awareness KPIs you can track.
Share of Voice is calculated by dividing your brand’s mentions by the total mentions of all brands in your market (including yours) and multiplying by 100. It turns chaotic social chatter into a measurable benchmark of your brand's influence.
How to Track Social KPIs
Keeping an eye on these metrics gives you an incredible feedback loop to fine-tune your content and overall strategy. Here’s a simple way to approach it:
Engagement Rate: This one’s pretty straightforward. Most social platforms have built-in analytics dashboards. To calculate it yourself, just add up a post's total engagements (likes, comments, shares), divide that by your total follower count, and multiply by 100. This gives you a clean percentage you can track over time to see what’s working.
Share of Voice (SoV): Calculating SoV is a bit more involved and usually requires social listening tools like Brandwatch, Meltwater, or Sprout Social. These platforms scan the internet for mentions of your brand, products, and competitors. You simply set up trackers for key phrases and brand names, and the tools automatically gather the data you need for the SoV formula.
By monitoring both engagement and SoV, you get a powerful, dual perspective. You’ll see how deeply you’re connecting with your existing audience and how effectively you're carving out a space for yourself in the wider market conversation. It’s how you turn raw social data into real strategic intelligence.
Capturing Audience Perception with Feedback and Surveys

While all the digital analytics tell you what your audience is doing, they almost never reveal the why. To really get inside your customers' heads and see how they perceive your brand, you have to go straight to the source. That’s where qualitative brand awareness KPIs, like feedback and surveys, come in. They give you the raw, unfiltered truth.
One of the most powerful—and often overlooked—metrics here is the volume and quality of your customer reviews. Think about platforms like G2, Trustpilot, and Capterra. They're basically the new word-of-mouth, but with a massive megaphone. When you see a steady stream of new reviews, it's a huge sign that your brand isn't just reaching people; it's making enough of an impact that they're compelled to talk about their experience.
This kind of active engagement is worth so much more than a simple website visit. It shows people not only know who you are but are actively interacting with your brand. In fact, brands that see a 25%+ jump in their review volume over a year often see a major boost in overall brand exposure. If you want to dig deeper into this, Mentionlytics has some great insights on using these metrics.
Gaining Deeper Insight with Targeted Questions
Beyond just waiting for public reviews, you can take control of the narrative by using targeted surveys. These don’t have to be some massive, complicated undertaking. Honestly, the simplest questions are often the most revealing.
The Net Promoter Score (NPS) is a classic for a reason. Asking, "On a scale of 0-10, how likely are you to recommend our brand to a friend or colleague?" gives you a straightforward, number-based look at brand loyalty and satisfaction.
Another incredibly useful tactic is to just ask, “How did you hear about us?” It’s a simple question you can pop into a signup form or a thank-you page after a purchase. The answers you get are pure gold, filling in attribution gaps that your automated tools will always miss. It’s the perfect way to connect the dots between your marketing spend and actual customer acquisition.
Key Questions for Brand Perception Surveys
To really round out your understanding, you’ll want to mix and match a few different types of questions in your surveys.
Here are a few to get you started:
- Brand Association: "What three words pop into your head when you think of our brand?" This gets to the heart of how people feel about you.
- Aided Awareness: "Which of these brands have you heard of?" Stick your brand name in a list with your competitors to see how you stack up in terms of recognition.
- Unaided Recall: "When you think of [your industry], what’s the first brand that comes to mind?" This is the holy grail. If your name comes up here, you’ve achieved top-of-mind awareness.
By blending this kind of qualitative feedback with the hard data from your digital and social channels, you start to build a truly complete, 360-degree picture of your brand's health and how it's seen in the market.
Building Your Custom Brand Awareness Dashboard
Gathering individual data points is one thing. But turning them into a cohesive story? That's where the real power lies. A custom brand awareness dashboard moves your most important metrics from scattered spreadsheets into a single source of truth.
This isn't about tracking every possible number. It's about hand-picking the specific brand awareness KPIs that actually matter to your business goals. For example, a startup clawing its way into a crowded market might be obsessed with Share of Voice (SoV) and branded search volume. Meanwhile, an established company might focus more on Direct Traffic to gauge brand loyalty and recall. The goal is to build a dashboard that tells you what you need to know at a glance.
Choosing the Right Tools and Metrics
Creating your dashboard starts with picking the right tools, and you don’t need an expensive, complicated system from day one. Free platforms like Google's Looker Studio (what used to be Data Studio) are surprisingly powerful for getting started. They let you pull data from Google Analytics, Search Console, social media, and more into one clean, visual interface.
This Looker Studio example shows how you can visualize multiple data streams—like user sessions, engagement rates, and traffic sources—to quickly get a feel for performance. As your needs grow, you can integrate data from more advanced tools. When building your dashboard, you might also want to explore Google Analytics alternatives to make sure you're using the best setup for your specific needs.
Your dashboard should tell a story. Group your KPIs logically to make that story easy to follow.
- Top-of-Funnel Reach: Group metrics like social media impressions and referral traffic to see how well you're capturing fresh attention.
- Audience Engagement: Combine social engagement rates, time on page, and brand mentions to measure how deeply your message is connecting.
- Brand Recall & Loyalty: Track direct traffic, branded search volume, and customer survey results (like NPS) to confirm you're building lasting recognition.
Structuring Your Dashboard for Clarity
A great dashboard knows the difference between leading and lagging indicators. Leading indicators (like social media engagement) are your crystal ball—they predict future success. Lagging indicators (like direct traffic) are your report card—they confirm past efforts actually worked.
Your dashboard should be more than a data graveyard; it should be a decision-making engine. Organize it to answer your most pressing questions: "Is our brand becoming more visible?" and "Are people actively choosing us?"
A logical layout might look something like this:
- High-Level Summary: Start with a scorecard of your absolute must-know KPIs (e.g., month-over-month Direct Traffic growth, current SoV). This is your 5-second health check.
- Trend Analysis: Use line charts to show how key metrics are performing over time. Are branded searches climbing? Is referral traffic holding steady?
- Channel-Specific Performance: Dedicate sections to social media, search, and PR, each with its own set of relevant metrics. This helps you see what's working where.
- Qualitative Insights: Don't forget the human element. Include a small section summarizing customer feedback or survey highlights to add context to the numbers.
This kind of structure transforms raw data into a clear narrative, proving your marketing’s value and guiding what you do next.
Common Brand Tracking Mistakes and How to Avoid Them

Knowing which brand awareness KPIs to track is a great start, but it's really only half the battle. The other half is dodging the common pitfalls that can make your data useless—or worse, lead you to completely wrong conclusions. Getting a handle on these mistakes is crucial for painting an accurate picture of your brand’s health.
One of the most common traps is getting laser-focused on vanity metrics. Sure, those raw impression numbers or follower counts look fantastic in a report, but they often lack any real context. A million impressions mean nothing if they aren’t reaching the right people or sparking any genuine interest.
Don't chase the big, empty numbers. Instead, pivot to KPIs that show real engagement and intent, like your branded search volume or direct traffic to your website.
Overlooking Qualitative Feedback
Another huge misstep is ignoring the human element of brand perception. If you're only looking at quantitative data, you're missing the why behind the numbers. You might see a sudden dip in social media engagement but have zero clue what actually caused it.
This is where qualitative feedback becomes your superpower.
Don’t just measure what people do; find out what they think. Combining analytics with customer surveys, social listening for sentiment, and review analysis provides a complete narrative, not just a data point.
This blend of hard data and human insight helps you connect with the emotions and opinions that truly drive how your audience behaves.
Failing to Benchmark Against Competitors
Finally, a lot of brands make the mistake of tracking their KPIs in a total vacuum. Seeing a 10% jump in your social media Share of Voice sounds pretty impressive on its own, right? But what if your main competitor grew theirs by 30% during that same time? Suddenly, your progress looks more like a competitive loss.
To steer clear of this, always benchmark your performance against key competitors. This simple practice adds the essential context you need to evaluate your brand awareness KPIs accurately. It transforms your internal report card into a true reflection of your standing in the market, helping you make smarter, more strategic moves for long-term growth.
Of course. Here is the rewritten section, crafted to sound like it was written by an experienced human expert.
Putting Your Brand KPIs Into Practice: A Few Common Questions
Alright, so you’ve got a plan to track your brand’s performance. That’s the first step. But even the best plans run into real-world questions once you start putting them into motion. Let’s tackle some of the most common hurdles I see teams face when they start getting serious about brand metrics.
"How Often Should We Actually Report on This Stuff?"
This is probably the number one question I get. The answer? It really depends on what you're measuring.
Think of your KPIs in two buckets: leading and lagging indicators. Leading indicators like social media engagement and website traffic are your early warning system. You should be glancing at these weekly, maybe bi-weekly. This lets you spot trends as they happen and make quick tweaks to your campaigns before it’s too late.
On the other hand, lagging indicators like Share of Voice or the results from a brand recall survey are a different beast. These are slow-burn metrics. Checking them too often is like watching water boil—it’s frustrating and you won’t see much change. A quarterly review is perfect for these. It gives enough time for your efforts to actually make a dent and show meaningful, long-term shifts.
"How Do We Set Benchmarks That Aren't Just Pulled Out of Thin Air?"
Setting the right goals is another major challenge. Your benchmarks should never be arbitrary; they have to be grounded in your reality. A brand-new startup fighting for its first mention is playing a completely different game than an established industry leader.
First, look inward. Dive into your own historical data to figure out your baseline. What’s “normal” for you right now? Once you have that, it’s time to look outward. Use competitive analysis tools to get a feel for how you measure up against others in your space.
This two-pronged approach gives you a realistic target. Instead of saying, "Let's grow!", you can set a specific, informed goal like increasing branded search volume by 15% or bumping up your social Share of Voice by 5% this quarter.
It's not just about tracking numbers for the sake of it. The real magic happens when you connect brand awareness KPIs to actual business outcomes. This is how you get buy-in from skeptical stakeholders who want to see the bottom-line impact. Show them how that bump in direct traffic directly correlates with a surge in high-quality leads.
"Okay, But How Do We Prove the ROI of Brand Building?"
This is the million-dollar question, isn't it? How do you prove the value of what can feel like fuzzy, top-of-funnel activities? The secret is to connect the dots and tell a compelling story. Never, ever present your brand metrics in a vacuum.
You need to create reports that walk stakeholders through the entire customer journey. Here’s how you can frame it:
- Awareness: Start by showing how your PR and content efforts led to a measurable increase in earned media mentions. "We did this, and this happened."
- Consideration: Next, point to the direct result of that awareness—a corresponding lift in people actively searching for your brand name. "Because more people heard about us, more people looked for us."
- Conversion: Finally, close the loop. Highlight how that wave of interested searchers translated into more direct traffic and, ultimately, more demo requests or sales. "And when they found us, they converted."
By weaving this complete narrative, you transform abstract numbers into tangible proof of business growth. It’s no longer just a "brand awareness campaign"; it's a powerful engine for the business, making a rock-solid case for continued investment.
Ready to amplify your brand’s social presence and connect with a massive network of creators? JoinBrands offers an all-in-one platform to manage influencer campaigns, generate authentic user-generated content, and accelerate sales. Find the perfect creator for your brand today at JoinBrands.