


 Your Guide to Amazon Influencer Programs
"Content performance metrics" might sound like another bit of marketing jargon, but they're simply the data points that tell you if your content is actually working. Think of them as the vital signs for your content strategy. The big ones you'll hear about are engagement rate, conversion rate, and organic traffic, and for good reason—they tie directly back to how people are interacting with your work and, ultimately, how it impacts your business.
Table of Contents
Why Your Content Metrics Matter
Relying only on clicks and page views to measure content success is like judging a restaurant by how many people walk through the door. It tells you nothing about whether they enjoyed the food, if they'll ever come back, or if they actually bought anything. The real story isn't about who showed up; it's about what happened next.
That’s where deeper content performance metrics come in. They paint the full picture. Instead of just seeing how many people saw your article, you can see what they did afterward. Did they stick around and read to the end? Did they download your guide? Did that blog post lead to a sale? This is the kind of data that turns your content from just words on a page into a serious business driver.
The Iceberg Effect of Content Analytics
Vanity metrics like page views are really just the tip of the iceberg. They’re easy to see and feel good to report, but the real mass and power are hidden beneath the surface. That’s where you find the metrics that measure true engagement and conversions.
This is a great way to visualize the hierarchy of content metrics, showing how we move from simple, surface-level numbers to data that has a real, tangible impact on the business.
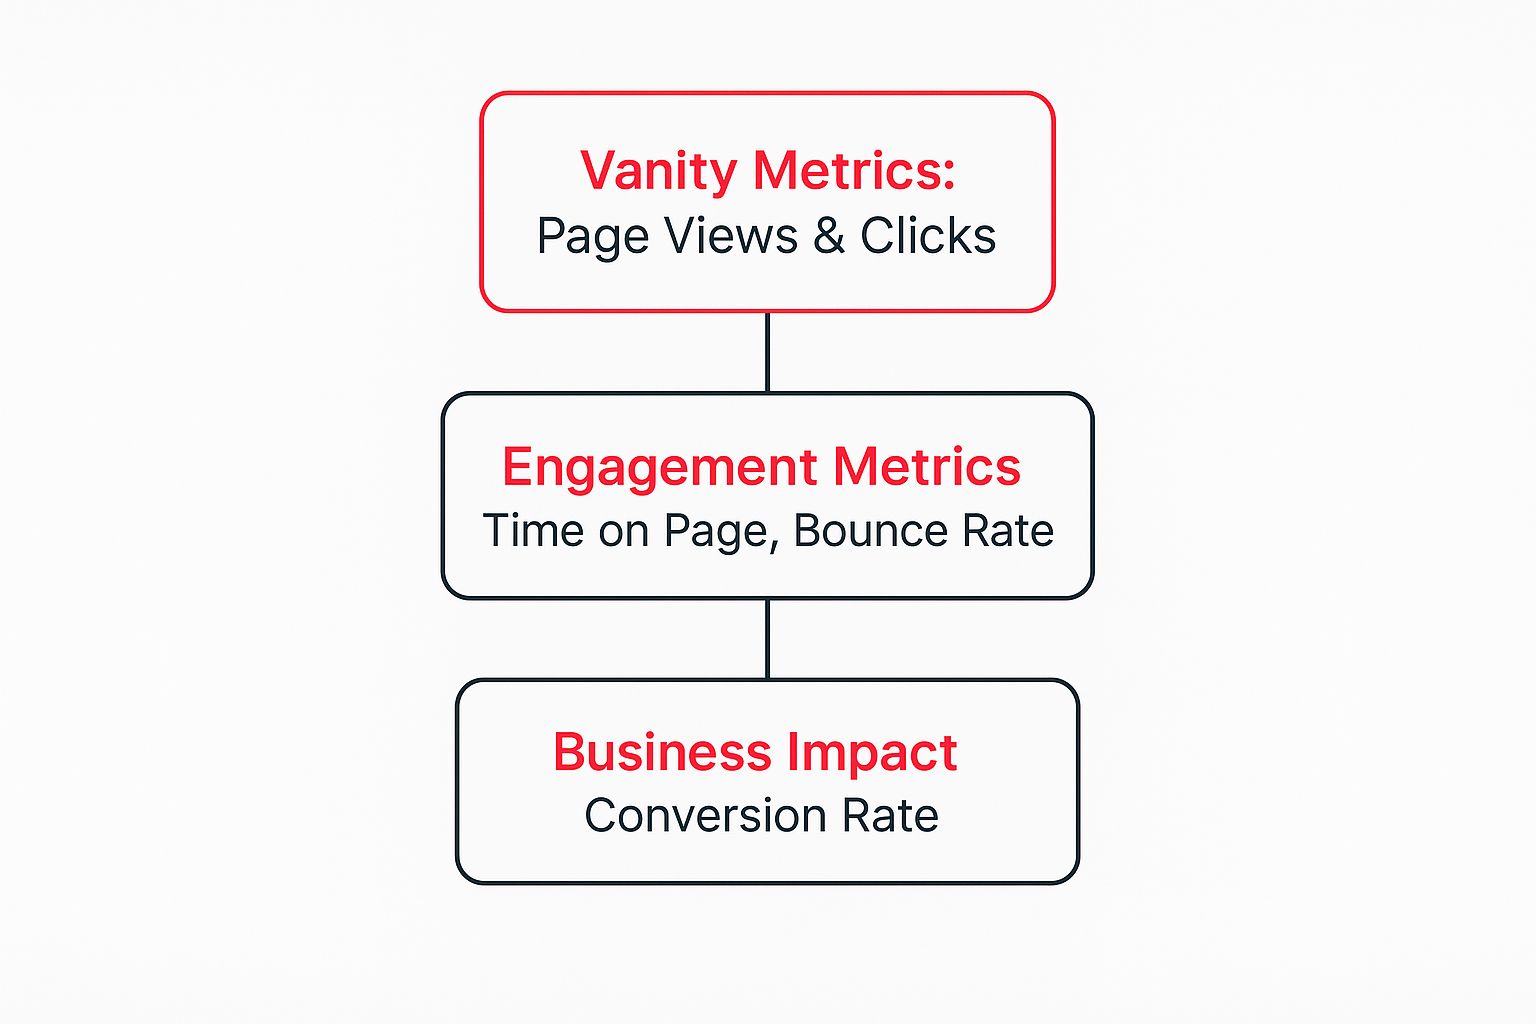
As you can see, the most valuable insights come from metrics that are directly linked to business outcomes, like conversion rates.
By focusing on metrics that signal genuine user interest and action, you can make smarter decisions, prove your content's ROI, and build a strategy that delivers sustainable growth.
Let's break down the main categories of metrics you'll be looking at.
Key Content Performance Metrics Categories
Here's a quick table to help organize the different types of metrics and what they're designed to measure.
| Metric Category | What It Measures | Example Metrics |
|---|---|---|
| Consumption Metrics | How many people are viewing or accessing your content. | Page Views, Unique Visitors, Video Views |
| Engagement Metrics | How users are interacting with your content. | Time on Page, Bounce Rate, Likes, Shares, Comments |
| Retention Metrics | How well you're keeping your audience coming back. | Return Visitors, Newsletter Subscribers, Follower Growth |
| Conversion Metrics | How effectively content drives business goals. | Conversion Rate, Leads Generated, Cost Per Acquisition (CPA) |
| SEO Metrics | How visible your content is in search engines. | Organic Traffic, Keyword Rankings, Backlinks |
This framework helps you see that while getting eyes on your content (Consumption) is the first step, the real magic happens when you can measure what those eyes do next.
Looking at how your past content has performed has always been the best way to shape what you do next. When you dig into data like unique visitors, time on page, and the number of leads generated, you start spotting patterns that show you what’s resonating and what’s not. For a deep dive into the most essential content performance metrics, this guide is an excellent resource to get you started.
Understanding Engagement Metrics

Getting a visitor to your page is one thing, but what happens next? Did you grab their attention, or did they bounce immediately? This is where engagement metrics come in. They’re the storytellers of your content, showing you exactly how people are interacting with what you’ve created.
These metrics go way beyond just counting visitors. They tell you if the people who showed up actually decided to stick around for the party.
Think of it like hosting a dinner. Getting guests through the door (traffic) is the first step. But the real measure of success is seeing if they're enjoying the conversation, trying the food, and staying for dessert. Those interactions are the heart of engagement, and they are critical content performance metrics to track.
Decoding User Behavior with Key Metrics
To really get what your users are doing, you need to look at a few specific data points. Each one is a clue, and when you put them together, you get a clear picture of how well your content is landing.
Three of the most powerful engagement metrics are:
- Average Engagement Time: This tells you the average amount of time your webpage was the main focus in a user's browser. A longer time is a great sign that your content is hitting the mark and keeping them hooked.
- Bounce Rate: This is the percentage of people who land on your page and leave without doing anything else—no clicks, no scrolling, nothing. It’s a gut check for whether your content delivered on the promise that got them there.
- Scroll Depth: This one is simple but effective. It tracks how far down the page people are actually scrolling. It tells you if you're holding their attention past the first few paragraphs.
The real magic happens when you analyze these together. For instance, a high average engagement time but a low scroll depth is a red flag. It might mean your intro is so confusing that people are getting stuck there without ever reaching your main points.
Turning Engagement Data into Actionable Insights
Knowing the numbers is only half the battle. The real goal is to use them to make your content better. A high bounce rate, for example, is a signal to start digging. Is the page loading too slowly? Is your headline misleading? Is the content just not answering the user's question?
Likewise, if you notice that scroll depth is consistently low across several articles, it could mean your paragraphs are too long and dense. Maybe your intros just aren't compelling enough to pull readers down the page. This is your cue to experiment with shorter paragraphs, punchy subheadings, or more visuals to keep people reading.
By keeping a close eye on these interactions, you can start refining your content to give your audience exactly what they want. To see how all these different interactions add up, it's worth learning more about how an engagement rate calculator works and why it’s so important.
Connecting Content to Conversions

So, your audience is clicking, reading, and sharing. That's great. But is any of that interest actually turning into business? This is where the rubber meets the road.
Conversion metrics show you if your content is doing its job—moving people from simply being readers to becoming actual customers. It’s the final, and frankly, the most important piece of the content performance puzzle.
Think of your content like a top-notch salesperson. It can be charming and get a ton of laughs, but if it never closes a deal, what's the point? Conversion metrics are that salesperson's commission report. They prove your content is driving actions that directly impact your bottom line.
Key Conversion Metrics to Track
To get a real sense of your content's business value, you need to zero in on the content performance metrics that are tied to revenue. We're moving past simple clicks and views and into the world of financial return.
Here are the three big ones you can't ignore:
- Conversion Rate: This is the percentage of people who take a specific action you want them to take. That could be downloading an ebook, signing up for a webinar, or making a purchase. It's the cleanest way to see how persuasive your content really is.
- Leads Generated: This one’s straightforward—it's the raw number of potential customers your content brings in. A blog post that pulls in 50 qualified leads is almost always more valuable than one with 10,000 views and zero leads.
- Cost Per Acquisition (CPA): How much are you spending to get one new customer through your content? A low CPA means your content isn't just a marketing expense; it's a lean, mean, profitable growth machine.
Keep an eye on these, and you’ll be able to walk into any meeting and confidently show the direct ROI of your content strategy. No guesswork needed.
From Blog Post to Bottom Line
Let's break it down with a real-world scenario. Say you publish a killer blog post called "10 Ways to Improve E-commerce Checkout."
- Attraction: The post starts ranking on Google and pulls in a steady stream of organic traffic.
- Action: Inside the article, you've smartly placed a call-to-action (CTA) for a free "Checkout Optimization Checklist." A visitor loves the post, clicks the CTA, and fills out a form to get the checklist. Boom—that's a conversion, and you've just gained a new lead.
- Nurturing: Over the next few weeks, that lead gets a few automated emails packed with more helpful tips and insights.
- Sale: Finally, feeling confident in your expertise, the lead books a demo for your e-commerce software and signs up as a paying customer.
By tracking this whole sequence, you can draw a straight line from that final sale all the way back to the original blog post. This is how you prove content ROI—by connecting the dots from a piece of content to real, hard revenue.
Understanding this journey is everything. Customers rarely make a decision after seeing just one thing, so it's critical to know which touchpoints are pulling the most weight. If you want to get more advanced, you can learn what is attribution modeling to figure out how to give credit to each step along the way.
And setting up the tracking for this isn't as complicated as it sounds. Tools like Google Analytics let you create "Goals" for specific actions, like when someone submits a form or clicks a particular button. Once that's set up, you can see exactly which pages are your conversion superstars, letting you double down on what’s working and fix what isn’t.
Getting someone to your site once is a good start. Getting them to come back? That’s where the magic happens.
This is where retention and satisfaction metrics come into play. They go way beyond just counting one-time visits to see if you're actually building a loyal audience, not just generating temporary traffic.
Think of it like this: a single visit is like a tourist wandering into a local shop once. A returning visitor is the regular who knows the owner by name and stops by every week. One is a transaction; the other is a relationship. Your goal is to build those relationships.
The Psychology of Returning Visitors
The ratio of New vs. Returning Visitors is one of the quickest ways to check your content's "stickiness." A healthy number of returning visitors is a huge sign that your content is genuinely valuable, making people want to come back for more. It shows you're building a real community.
On the flip side, if nearly all your traffic is from new visitors, it might be a red flag. Maybe your content solves a one-off problem but doesn't give anyone a reason to stick around. This is your cue to think about creating content series, launching a newsletter, or finding other ways to keep people engaged.
You can easily track this in Google Analytics, which splits out new and returning users over time.
What you want to see is that blue line (returning users) steadily climbing. That's proof your retention efforts are working.
Measuring How Long Your Content Captivates
Another huge piece of the satisfaction puzzle is Dwell Time. We've moved past simple metrics like "time on page." Dwell Time is more specific: it measures how long a person spends on your page before clicking back to the search results. Find out more about how these advanced metrics can define your blogging success at blogmaker.app.
A long Dwell Time is a powerful signal to search engines that your content hit the mark and thoroughly answered the user's question.
When a visitor spends several minutes on your page before going back to Google, they're basically telling the search engine, "Yep, this was a great answer." Over time, that positive feedback can give your search rankings a serious boost.
Finally, don't sleep on social proof. Social media shares are a direct thumbs-up from your audience. When someone shares your article, they're staking their own reputation on it by recommending it to their network. Keeping an eye on shares, comments, and mentions gives you real-world feedback on what your readers love most, helping you decide what to create next.
Choosing Your Content Tracking Tools

All the metrics in the world are useless if you can’t actually see them. Without the right tools to collect, sort, and make sense of the data, you’re just flying blind.
Think of these tools like the dashboard in your car. They take all the complex signals from the engine and turn them into simple, actionable information you can understand at a glance—your speed, your fuel level, maybe a check engine light. Your content analytics tools do the exact same thing, translating raw data into clear content performance metrics.
Picking your tech stack doesn’t have to be some overwhelming task. You can get incredibly powerful insights by starting with a few foundational platforms—many of which are free—before you even think about the more specialized options.
The Foundational Analytics Duo
For pretty much every business, the journey into content analytics kicks off with two powerhouse tools from Google. They form the bedrock of any solid measurement strategy, each one handling a different, yet equally important, job.
Google Analytics (GA4): This is your eye inside your website. It's the tool that answers the big questions: Who’s visiting my site? What pages are they looking at? How long are they sticking around? This is where you'll find essential metrics like Average Engagement Time and your all-important Conversion Rate.
Google Search Console (GSC): This one is all about how your site performs out in the wild world of Google Search. GSC is what tells you which keywords are actually bringing people to your site, what your average ranking is for those terms, and how many times your pages are showing up in search results. It’s absolutely vital for keeping tabs on your SEO health.
Here’s a simple way to think about it: Google Search Console is what gets people to your front door. Google Analytics tells you exactly what they do once they step inside. Using both gives you the complete story, from search result to on-page action.
Specialized Tools for Deeper Insights
Once you have the basics down, you can start layering in more specialized tools to zoom in on specific parts of the user journey.
For example, heatmap tools like Hotjar are fantastic for getting a visual read on user behavior. They literally show you where people are clicking, how far they scroll down a page, and what elements they ignore, giving you a much clearer picture of how your design is performing.
When it comes to social media, platforms like Buffer or Sprout Social are indispensable. They track the engagement happening off your website—the likes, shares, comments, and saves. This is a must-have for any brand that uses social channels to get their content out there. If you want to dive deeper, check out our complete guide on how to track social media analytics to build a comprehensive view of your audience.
Comparison of Content Performance Tracking Tools
To help you figure out what you might need, here’s a quick breakdown of some of the most popular tools and what they do best. This isn't an exhaustive list, but it covers the essentials that most businesses rely on to get a handle on their performance.
| Tool Name | Primary Function | Best For | Pricing Model |
|---|---|---|---|
| Google Analytics | Tracking on-site user behavior and conversions. | Every website owner, from beginner to expert. | Free |
| Google Search Console | Monitoring organic search performance and SEO health. | Anyone serious about their SEO strategy. | Free |
| Hotjar | Visualizing user behavior with heatmaps and recordings. | Optimizing user experience and page layouts. | Freemium |
| Buffer / Sprout Social | Managing and analyzing social media engagement. | Brands active on multiple social platforms. | Subscription |
Remember, the goal isn't to use every tool available. It's about building a simple, effective stack that gives you the specific insights you need to make smarter decisions about your content. Start with the free, foundational tools and only add more as you identify a clear need.
Putting Your Metrics into Action
Understanding your data is one thing, but actually using it to make smarter decisions is the real goal here. Turning your content performance metrics into action is what separates guessing from a data-driven strategy of constant improvement. This means getting out of the tracking-only mindset and into a cycle of analysis, action, and refinement.
Let's walk through a common scenario. A blog post is killing it with organic traffic, but the conversion rate is dismal. The raw numbers show plenty of interest, but there’s zero business impact. This is exactly where your metrics become a diagnostic tool.
From Diagnosis to Optimization
Digging into the data lets you form a solid hypothesis. Is the call-to-action (CTA) buried at the very bottom of the page? Is the offer totally irrelevant to what the article is about? Maybe the bounce rate is sky-high, which tells you the content just isn't living up to what people expected.
Based on this analysis, you can map out a few specific, data-informed changes:
- Action 1: Move the CTA up to a much more prominent spot, right above the fold.
- Action 2: Rewrite the CTA copy so it aligns better with what the reader is actually there for.
- Action 3: Add an internal link to a related article that you already know converts well.
The core takeaway is that content performance analysis is never a one-time task. It's a continuous loop of measuring what works, learning from what doesn’t, and systematically optimizing for better results.
This iterative process ensures every single piece of content evolves to reach its maximum potential. And when you're ready to get even more granular with paid campaigns, understanding specialized digital advertising performance metrics can give you an even clearer picture.
Got Questions? We've Got Answers.
Diving into your data can bring up a lot of questions. Let's tackle some of the most common ones that come up when people start really digging into their content performance.
How Often Should I Be Checking My Metrics?
Honestly, it depends on what you're looking at and what you're trying to achieve. Think of it like checking on a garden. Some things need daily attention, others just need a check-in once a month.
For fast-moving numbers like social media engagement or traffic to a brand-new blog post, a daily or weekly check-in is a good idea. It helps you catch a wave of momentum or put out a small fire before it spreads.
But for the slow-burn metrics—like organic keyword rankings or overall conversion rates—a monthly review makes more sense. These numbers take time to build, and looking at them too often is a recipe for stressing over normal, everyday ups and downs.
The real secret is consistency. Set a reporting schedule that works for you and stick to it. Whether it's a quick peek every week or a deep dive once a month, making it a habit is what turns data from an overwhelming chore into a powerful tool.
Okay, So Which Metric Is The Most Important?
This is the million-dollar question, but the truth is, there's no single "best" metric. The most important metrics are the ones that tell you if you're getting closer to your specific goals. It's all about what you're trying to accomplish.
- Want more people to know who you are? Keep your eyes glued to metrics like organic traffic, social shares, and impressions. These tell you how wide your net is being cast.
- Trying to generate leads? You'll want to prioritize conversion rate, form submissions, and cost per lead. These numbers are all about turning visitors into potential customers.
- Focused on building a loyal community? Pay close attention to returning visitors and average engagement time. This shows you who's coming back for more.
Your metrics are like players on a sports team. Each one has a specific job, but they all work together to win the game. Your goal determines who's in your starting lineup.
Can I Really Track This Stuff Without Spending a Fortune on Tools?
You absolutely can. While the fancy, high-end tools offer some incredible insights, you can build a rock-solid analytics setup without spending a dime.
Google Analytics and Google Search Console are the undisputed champs of free data. Together, they give you a massive amount of information on your traffic, how users behave on your site, and your overall SEO health. Get comfortable with these two, and you'll be able to track nearly every essential metric we've talked about.
Ready to team up with creators who know how to make content that actually moves the needle on your most important metrics? JoinBrands is the place to find the talent and tools you need to tell your brand's story and drive real growth. Explore how JoinBrands can elevate your content strategy today.