


 What Is an Influencer and How Do They Work
At its core, an engagement rate calculator is a simple tool that tells you how many people are actually interacting with your content. It cuts through the noise of vanity metrics like follower counts to show you who is actively listening and responding through likes, comments, and shares.
Table of Contents
What Is an Engagement Rate Calculator and Why It Matters
Think of your social media presence as throwing a party. Your follower count is the number of invitations you sent out. Your engagement rate? That’s how many people actually showed up, danced, and talked to other guests. Are you hosting a lively event, or are you just talking to an empty room?
An engagement rate calculator gives you the honest answer. It’s the health monitor for your content, telling you whether your message is genuinely connecting or just disappearing into the void.
Instead of getting hung up on follower numbers, this tool helps you gauge the real quality of your relationship with your audience. A high engagement rate points to a healthy, active community that loves what you're putting out there. On the other hand, a low rate is a red flag that something's off, even if you have a million followers.
Understanding the Core Metrics
To really get what's going on, you need to look at the specific actions people are taking. Each type of interaction tells a slightly different story about what your audience is thinking and feeling.
Here's a quick look at the main metrics and what they're telling you about your audience's interest.
Core Engagement Metrics at a Glance
| Metric Type | Examples | What It Measures |
|---|---|---|
| Likes | Thumbs-up, hearts, reactions | Quick approval or agreement. The simplest form of positive feedback. |
| Comments | Questions, replies, feedback | Deeper interest. Your content was compelling enough to spark a thought or conversation. |
| Shares | Retweets, reposts, DMs | High value. Your content was so good that someone wanted to broadcast it for you. |
| Saves | Bookmarks, saved posts | Future intent. Your audience found your content useful enough to revisit later. |
Each of these metrics provides a piece of the puzzle, helping you see the full picture of your content's performance.
This is why it's helpful to see engagement as the "Audience Pulse"—a direct measure of your content's vitality and its connection with the people who follow you.
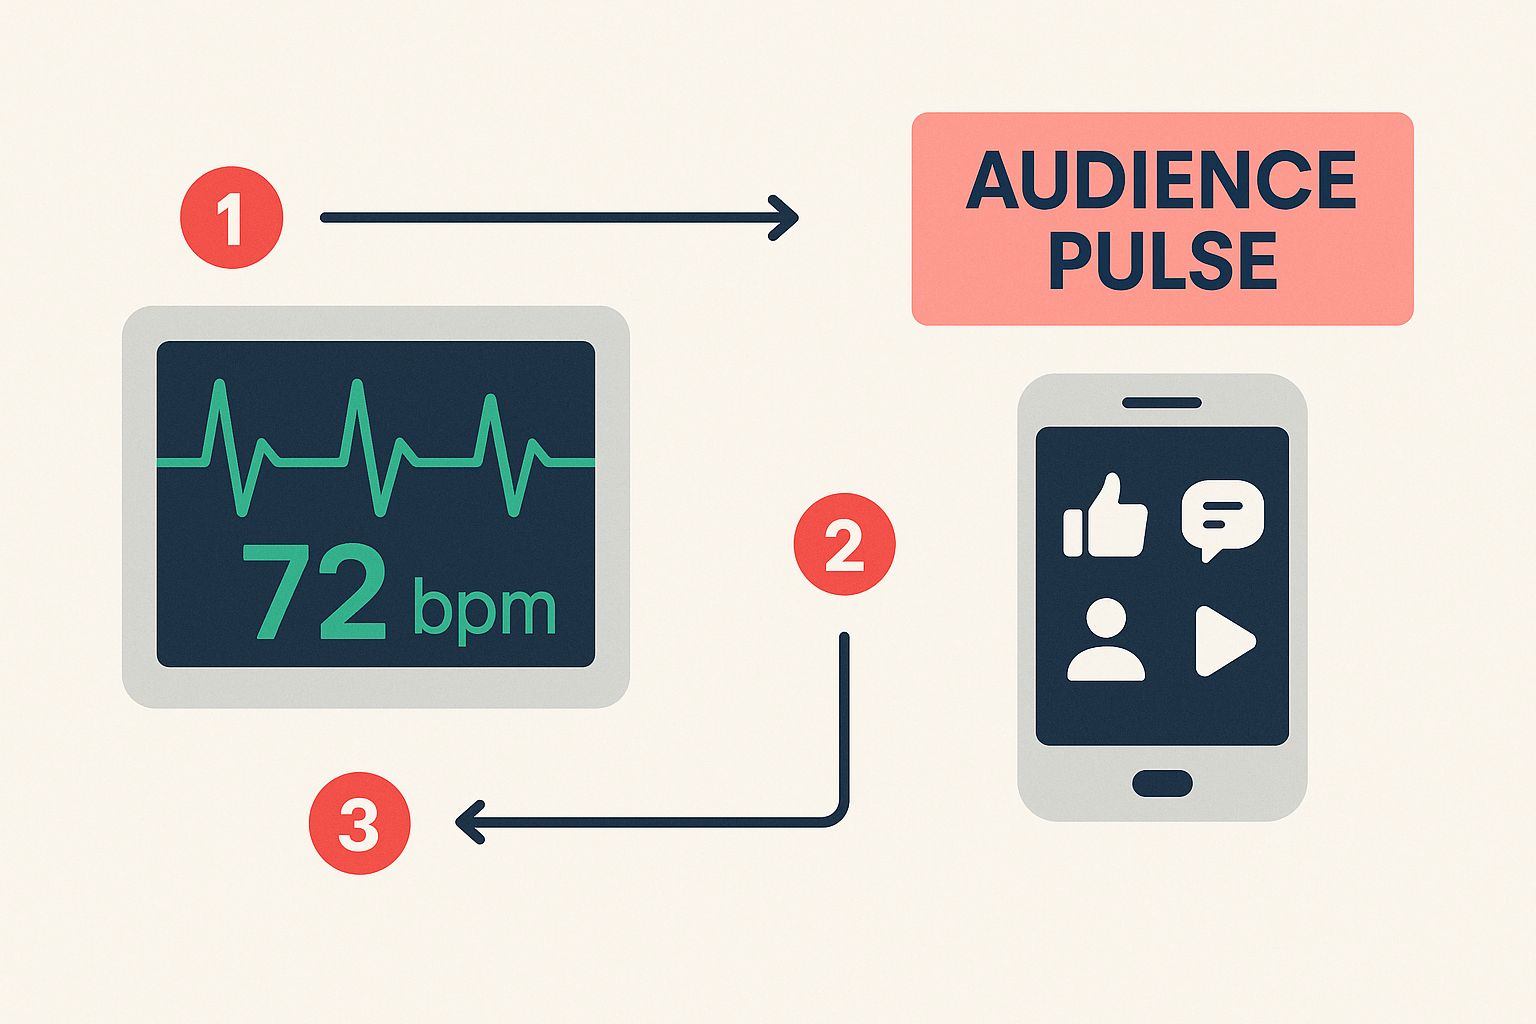
As the graphic shows, tracking these metrics is like checking a heartbeat. When you see consistent interaction, you know your brand’s message is alive, well, and resonating.
Why This Metric Is Crucial Today
Let's be real: the social media world is more crowded than ever. Breaking through the noise requires a genuine connection, and that’s becoming harder to achieve. The data doesn't lie. Globally, there are an estimated 5.42 billion social media users, but attention is spread thin.
We're seeing engagement rates decline across the board. In 2025 alone, Facebook's engagement dropped 36%, Instagram's fell by 16%, and X (formerly Twitter) plummeted by a massive 48%. This trend makes an engagement rate calculator non-negotiable for figuring out what still works. You can dive deeper into these social media statistics to see how the landscape is shifting.
How Engagement Rate Calculators Actually Work
An engagement rate calculator isn't some kind of magic tool spitting out random numbers. It’s actually pretty straightforward. Think of it like a recipe—it just follows a specific formula using your social media data as the ingredients.
Once you get a handle on these formulas, you're no longer just guessing about your performance. You're actually learning the rules of the game, which is the first step to winning it.
At its heart, the calculator just takes the total number of interactions on a post (or across all your posts) and divides it by an audience number, like your follower count or how many people saw the post. This simple math turns a raw number like "80 likes" into a percentage that actually tells you something useful.
But here’s the thing: there isn't just one single way to calculate engagement. There are three main formulas, and each one gives you a slightly different perspective on how your content is performing.
Engagement Rate by Reach (ERR)
This is the one most pros turn to for a gut check on how interesting their content really is. Why? Because it measures engagement against the number of people who actually saw your post, not just your total follower count. It cuts through the vanity metrics.
Let's imagine you run a local coffee shop. You have 2,000 followers, but your beautiful post about a new pumpkin spice latte only reached 800 unique people. That post got 80 interactions (a mix of likes, comments, and saves).
The formula for Engagement Rate by Reach looks like this:
(Total Engagements / Reach) x 100 = ERR
For our little coffee shop, that’s (80 interactions / 800 people reached) x 100, which gives us an ERR of 10%.
This method is so powerful because it isn't watered down by followers who were inactive or simply missed your post. It answers the question: "Of the people who saw this, what percentage cared enough to do something?" A high ERR is a fantastic sign that your content is hitting the mark and has the potential to spread.
Engagement Rate by Posts (ER Post)
This is probably the formula you see most often. It’s simple and measures a single post's engagement against your total follower count. It’s a great way to keep a finger on the pulse of your core, loyal audience.
Back to our coffee shop with its 2,000 followers. That same latte post got 80 interactions.
Here’s the formula for Engagement Rate by Post:
(Total Engagements on a Post / Total Followers) x 100 = ER Post
Plugging in the numbers, we get (80 interactions / 2,000 followers) x 100, which equals 4%.
See how that number is much lower than the ERR? That's because it's answering a different question: "What slice of my entire follower base engaged with this specific post?" While a solid ER Post shows you have a dedicated community, it can be a bit misleading since algorithms don't show your posts to all of your followers. If you're deep in the Instagram world, you can get a more detailed look at the Instagram engagement rate formula to really dial things in.
Engagement Rate by Impressions (ER Impressions)
Last but not least, we have Engagement Rate by Impressions. This one is a close cousin to ERR, but instead of using reach (unique viewers), it uses impressions (the total number of times your content was shown).
That’s a key difference. If one person saw your post on their feed, then again when a friend shared it, that’s 1 reach but 2 impressions.
So, let's say our coffee shop’s post was displayed 1,200 times and got those same 80 interactions.
The formula is:
(Total Engagements / Total Impressions) x 100 = ER Impressions
The math works out to (80 interactions / 1,200 impressions) x 100 = 6.67%.
ER Impressions is especially handy when you're running paid ads, since you often pay per impression. It tells you how effective your ad was every single time it popped up on someone's screen. Because your impression count will always be the same or higher than your reach, this rate will usually be lower than your ERR.
Each of these formulas tells a different part of your content's story. Knowing which one to use really just depends on what question you’re trying to answer.
Setting Realistic Engagement Goals with Benchmarks
So, you've plugged your numbers into an engagement rate calculator and now you have a percentage staring back at you. What now? Is 4% good? Bad? Just okay?
Honestly, that number means nothing without context. In some industries, a 4% engagement rate is phenomenal—the kind of result that gets you a promotion. In others, it might signal there's room to grow. Your data is just noise until you have a yardstick to measure it against.
This is where benchmarks come in. Think of them like the average score on a video game level. You can’t know if your score is impressive until you know what a "good" score even looks like. Benchmarks transform your raw data into a strategic advantage, showing you exactly where you stand in the competitive landscape.
The simple truth is, there's no magic number for a "good" engagement rate. It shifts dramatically depending on your industry, the platform you’re using, and even the kind of content you share. A fashion brand in the retail space is going to see completely different interaction levels than a B2B software company.
Comparing Engagement Across Industries
To set goals that are actually achievable, you first need to understand the field you're playing on. Engagement rate calculators are a marketer's best friend for this very reason—they let you measure your performance against clear, industry-specific data.
For example, a Retail brand might see an average engagement rate of 3.9% on a LinkedIn post, while their Instagram posts hover around 3.0%. But for a Technology company, the numbers are a bit different: 3.6% on LinkedIn and 3.3% on Instagram. These might seem like small differences, but they prove why comparing your tech brand to retail benchmarks would give you a totally skewed picture of your success. Hootsuite's 2025 engagement findings dive deeper into these distinctions.
This data hammers home one critical point: context is everything. Grasping these nuances is the first step toward setting targets that are tailor-made for your unique situation.
To give you a clearer idea, let's look at how some key industries stack up across different platforms.
Average Engagement Rates by Industry and Platform
A comparative look at engagement rate benchmarks across key industries and social media platforms, highlighting the importance of context in performance analysis.
| Industry | Platform | Average Engagement Rate (%) |
|---|---|---|
| Retail | 3.0% | |
| Retail | 3.9% | |
| Technology | 3.3% | |
| Technology | 3.6% | |
| Financial Services | 2.8% | |
| Financial Services | 3.1% | |
| Travel & Hospitality | 4.2% | |
| Travel & Hospitality | 2.5% |
As you can see, what's considered "average" can vary significantly. This is why a one-size-fits-all approach to social media goals just doesn't work.
How Platforms and Formats Change the Game
Beyond your industry, the platform itself has a huge say in your engagement rates. The way people behave on a professional networking site like LinkedIn is fundamentally different from the fast-paced, visual-first world of TikTok or Instagram.
Here's a snapshot of how much average engagement rates can differ across the major players, giving you a better sense of what's "normal" in each space.
This chart makes it obvious that Instagram tends to lead the pack, while platforms like Facebook and X (formerly Twitter) often have lower averages. This is crucial info to have when you're deciding where to put your time and marketing dollars.
Content format is another piece of the puzzle. Sometimes, how you say something matters more than what you say. For instance, a well-designed LinkedIn document can pull in a jaw-dropping 37% engagement rate, blowing a standard text post out of the water. On Instagram, a static image might earn 6.2% engagement, while a Reel could land closer to 3.5%.
Your goal isn't just to create great content, but to deliver it in the format your audience prefers on the platform where they are most active. This strategic alignment is key to boosting your numbers.
By understanding these benchmarks, you can stop asking "Is my engagement good?" and start asking, "How can I beat the average for my industry on this specific platform?" That shift in thinking is what separates basic social media management from a truly powerful content strategy. For a deeper dive, check out our guide on how to track social media analytics and make sense of all this data.
Trying to set goals without this context is like driving without a map. Use these benchmarks to build a clear, realistic, and data-informed roadmap for your brand's growth.
Measuring Engagement That Actually Drives Business
Figuring out your engagement rate is a great starting point, but the real magic happens when you start looking past the surface-level numbers. It’s time to ask a bigger question: which of these interactions are actually making a difference for your business?
Let's be honest, not all engagement is created equal.
A simple "like" is a nice little nod, but it’s passive. A thoughtful comment that kicks off a real conversation? That's far more valuable. A "share" instantly turns one of your followers into a brand advocate, doing your marketing for you. And a "save"? That’s someone telling you your content is so good, they need to come back to it later.
Understanding this distinction is the key to moving beyond measuring vanity metrics and starting to track real customer intent. To actually tie your social media efforts to business results, you have to dig deeper than a standard engagement rate calculator can take you.
Adopting a Weighted Engagement Model
Most free calculators are pretty basic. They throw every interaction—one like, one comment, one share—into the same bucket and call it a day. But if a share is ten times more impactful for your brand than a like, shouldn't your analysis show that? This is where the idea of weighted engagement comes in.
You won't find a simple online tool for this, but the concept is easy enough to grasp. You just assign a "weight," or point value, to each type of interaction based on how much it contributes to your goals.
Here’s a simple framework to get you started:
- Like: 1 point (A low-effort acknowledgment)
- Comment: 3 points (Requires actual thought and participation)
- Share: 5 points (Acts as a personal endorsement and expands your reach)
- Save: 5 points (Shows high value and an intent to return)
- Click-through: 10 points (Directly moves someone from social media to your website)
When you apply this kind of model, you get a much more accurate "engagement score" for every post. You might find that a post with fewer total interactions but more high-value ones (like shares and clicks) is actually your top performer—a crucial insight a basic calculator would completely miss.
Looking Beyond the Numbers with Qualitative Data
No matter how you weigh them, your analysis shouldn't stop with the numbers. The quality of the engagement often tells a much richer story. This is where you need to look at qualitative data, like the sentiment behind the comments.
Are the comments on your latest post overwhelmingly positive, full of praise and people asking where they can buy? Or are they negative, pointing out problems with your product or customer service? A post with 100 comments sounds amazing on paper, but if half of them are from angry customers, that engagement is a warning sign, not a win.
Tracking engagement without considering sentiment is like hearing applause without knowing if it's genuine or sarcastic. You need to listen to the tone of the conversation to understand the real story.
Connecting Social Metrics to Business Goals
Ultimately, the whole point of measuring engagement is to see how your social media efforts are contributing to the bottom line. The most sophisticated marketers track metrics that build a direct bridge between social activity and business objectives. For companies looking to really dial in their measurement, exploring comprehensive engagement tracking solutions can provide the tools needed to connect these dots.
This means you start tracking actions like:
- Website Visits from Social: How many people clicked the link in your bio or post and actually landed on your site?
- Leads Generated: Did that post promoting a webinar or e-book drive new sign-ups for your email list?
- Demo Requests or Sales: Can you trace a specific purchase directly back to a social media campaign or a creator collaboration?
When you measure these kinds of outcomes, you stop just calculating engagement and start proving ROI. You can walk into a meeting and say, "Our Instagram strategy last month drove 500 new website visitors and resulted in $2,000 in sales." That’s the kind of powerful insight that makes your data truly actionable.
How Global and Audience Factors Shape Your Results
Your engagement rate doesn't live in a bubble. Once you've plugged your numbers into a calculator, it’s all too easy to measure that single figure against some universal benchmark. But that approach misses a huge piece of the puzzle: your specific audience. Who they are and where they live fundamentally changes how they interact with your content.
Think of it like telling a joke. The same punchline can get a massive laugh in one room and total crickets in another. The joke itself didn't change, but the audience did. In the same way, your content's performance is deeply tied to the cultural and demographic context of the people seeing it.
Why Geography Changes the Game
Social media habits aren't one-size-fits-all; they shift dramatically from one country to the next. Things like user demographics, local culture, and overall social media penetration play a massive role. While about 64% of the world's population uses social media, how they use it is a totally different story.
For example, Nigeria clocks the highest daily usage at a staggering 238 minutes, yet its penetration rate is only 14.3%. Flip that around, and you have the UAE with a penetration rate over 100%, while the US sits around 72.5%. You can dig deeper into these global social media statistics to see just how wide the gaps are.
These numbers prove that high daily activity in a country doesn't automatically translate to high engagement for your brand. A campaign targeting a market with intense but narrow usage needs a completely different strategy than one in a market with broad but less frequent use. This context is everything when it comes to setting realistic goals.
This chart really drives home the vast differences in social media penetration across countries.
Looking at this, it's clear how flawed it is to chase a "global average." Markets like the UK (84.4%) and Canada (85.7%) are miles ahead of others, and your strategy has to reflect that reality.
The Power of Audience Demographics
Beyond just where your audience lives, their specific makeup—like age, interests, and online habits—creates its own unique engagement patterns. A brand targeting Gen Z on TikTok is going to see completely different interactions than a B2B company trying to reach executives on LinkedIn.
Trying to interpret your engagement rate without considering your specific audience is like trying to navigate London with a map of New York. Sure, it's a map, but it's not going to get you where you need to go.
To really get what your numbers are telling you, you have to filter any global or industry benchmarks through the lens of your unique audience.
Think about these factors when you're looking at your results:
- Age Group: Younger audiences might smash that 'like' button all day long, while older demographics may engage less often but leave more thoughtful, in-depth comments.
- Niche Interests: A tight-knit community of vintage camera collectors might have a small follower count, but their engagement rate could be through the roof because the content is hyper-relevant to them.
- Cultural Nuances: A meme or bit of slang that lands perfectly in one region could fall completely flat—or worse, be offensive—in another. This directly hits your comment and share rates.
When you layer this audience-specific context over your data, you stop just calculating a number and start understanding the story behind it. This smarter view helps you avoid the trap of comparing your niche community to broad, generic averages and lets you set goals that actually make sense for your brand.
Practical Strategies to Improve Your Engagement Rate

Knowing your numbers is a great start, but the real goal is to make them grow. Once you’ve got a baseline from your engagement rate calculator, it’s time to start testing strategies that build a more interactive and loyal community.
This isn’t about chasing vanity metrics. It’s about creating content so good your audience can't help but react. Forget the generic advice—we’re focusing on specific, proven tactics that create a powerful feedback loop. You test an idea, measure its impact, and refine your approach.
Craft Content That Demands a Response
The easiest way to get more interactions is to just ask for them. The trick is to do it in a way that feels natural and actually adds to the conversation, not just a lazy "comment below."
- Ask Open-Ended Questions: Don’t ask a simple yes/no question. Ask something that makes people think. Instead of a travel brand asking, "Do you like the beach?" try, "What's the one beach you dream of visiting and why?"
- Run Polls and Quizzes: Use features like Instagram Stories polls or Twitter polls. They're low-effort for your audience—a quick tap is an easy win that still boosts your engagement.
- Use "This or That" Posts: Pit two popular things against each other and let your audience pick a side. This simple format taps into people's desire to share their opinion and can get a fun debate going in the comments.
These methods work because they turn passive scrolling into an active experience. You're giving your followers a clear, easy way to join in.
Optimize Your Visuals and Posting Cadence
How and when you post matters just as much as what you post. Some formats are just naturally more engaging, and timing can absolutely make or break your reach.
First things first: prioritize video. It’s the ultimate scroll-stopper and attention-grabber. If you're serious about maximizing your impact on platforms like TikTok and Instagram Reels, you need to be optimizing video formats for maximum engagement.
Your content strategy should be a constant experiment. Test different post types, captions, and times. Use your engagement rate calculator to identify what resonates most, then double down on what works.
Also, dig into your analytics to find your unique best times to post. Sure, there are general guides out there, but your audience is different. Your own data will show you the exact days and hours when your followers are most active and ready to interact.
Actively Manage Your Community
Social media is a two-way street. If you want people to engage with you, you have to engage right back. Active community management sends a clear message: you're listening and you actually value what your followers have to say.
This means responding to comments—especially questions—as quickly as you can. A fast, helpful reply can turn a casual commenter into a die-hard fan.
And don’t just sit back and wait. Proactively engage with other accounts in your niche and interact with your followers' own posts. This builds goodwill and keeps your brand top-of-mind. As you build a stronger community, you’ll naturally see your engagement numbers climb.
For a deeper dive, our guide to improving your Instagram engagement rate has even more tactics you can put into action today.
Got Questions? We've Got Answers
Even after you get the hang of the formulas and benchmarks, a few common questions always seem to pop up. Let's tackle them head-on so you can start calculating your engagement rates with total confidence.
Is a Higher Follower Count Always Better?
Nope, not really. It’s easy to get fixated on that big follower number, but it’s often a vanity metric. While a large audience gives you more potential reach, it can easily lead to a lower engagement rate.
Think about it: A small, tight-knit community that genuinely loves and interacts with your content is way more valuable than a massive, passive one.
Who would you rather have?
- 1,000 followers who comment, share, and actually buy from you.
- 100,000 followers who just scroll right on by.
The choice is obvious. Focus on building a quality audience, not just chasing a big number.
How Often Should I Calculate My Engagement Rate?
There's no single magic number here—it really depends on your goals and posting frequency. That said, a great rhythm for most brands is to check in weekly or monthly.
A simple schedule could look like this:
- Weekly Check-ins: Perfect for seeing how specific posts or campaigns are performing right now.
- Monthly Reviews: This is where you zoom out to spot broader trends and see if your strategy is paying off.
- Quarterly Analysis: Best for high-level reporting and making those big-picture strategic shifts.
The most important thing is consistency. Sticking to a regular schedule helps you understand what resonates with your audience so you can adapt and improve over time.
Don't make the classic mistake of obsessing over the engagement rate of every single post. It’ll drive you crazy. Instead, focus on your average rate over a set period. This gives you a much more stable and accurate picture of how you're really doing.
Which Engagement Formula Is the Best One to Use?
Ah, the big question! The "best" formula really just depends on what you’re trying to measure. Each one tells a slightly different story, and they're all valuable.
Here’s a quick breakdown:
- Use Engagement Rate by Reach (ERR) when you want to know how interesting your content is to the people who actually see it.
- Use Engagement Rate by Post (ER Post) to see how your loyal, existing followers are responding to your content.
- Use Engagement Rate by Impressions when you’re running paid campaigns and need to evaluate performance based on how many times your ad was shown.
If you ask most social media pros, they'll tell you ERR is the go-to for organic content. Why? Because it gives you the most honest look at your content's quality, cutting through the noise of tricky algorithms.
Ready to stop guessing and start growing? JoinBrands connects you with over 250,000 creators to produce authentic content that genuinely resonates with your audience. Find the perfect partners to boost your engagement and drive real business results. Discover how JoinBrands can amplify your social presence today.