


 A Brand’s Guide to Influencers in Instagram
Before you can start calculating anything, you need to get a handle on what you're actually measuring. Think of an impression as the most basic unit of visibility for your campaign—it’s a single instance of your ad or content being shown on a screen. Simple as that.
Table of Contents
What Are Impressions and Why Do They Matter?

At its most fundamental level, an impression just means your content was successfully delivered to someone's feed or a webpage.
It’s crucial to know that this doesn't mean they engaged with it, clicked it, or even really saw it. It just means it was there, loaded on the screen. This is the starting point for almost all performance analysis in digital advertising.
Calculating impressions is really just about counting how many times a piece of content is displayed. The concept isn't new; it has roots in traditional print media where it referred to potential views. With the shift to digital, it became an essential metric for gauging the reach of online ads.
Served vs. Viewable Impressions
Now, here’s a critical distinction that can seriously impact your budget and how you analyze performance: the difference between served and viewable impressions. Getting this wrong can lead you to some pretty flawed conclusions about your marketing.
- Served Impressions: This is the old-school way of counting. An impression is logged the second an ad server pings a publisher's site. The problem? It doesn't guarantee the user ever had a chance to see it. The ad could have loaded at the bottom of a page the user never scrolled to.
- Viewable Impressions (vCPM): This is the metric that truly matters today. A viewable impression is only counted when a certain percentage of the ad (say, 50%) is actually visible on the screen for a minimum amount of time (like one second).
By focusing on viewable impressions, you're ensuring your ad dollars are spent on ads that people could actually see. This leads to much more accurate and honest campaign assessments.
Before we go any further, let's break down the key terms you'll encounter. Having these concepts down is non-negotiable for making sense of your data.
Key Impression Metrics at a Glance
| Metric | What It Means | Why It Matters |
|---|---|---|
| Impression | One single display of your content on a screen. | The basic unit of measurement for ad visibility and the top of your marketing funnel. |
| Reach | The number of unique people who saw your content. | Tells you how broad your audience is. One person seeing an ad 5 times is 5 impressions but a reach of 1. |
| Served Impression | An ad is counted as soon as it's sent to the website. | An older metric that doesn't guarantee the ad was actually seen by a person. |
| Viewable Impression | An ad is only counted when a portion of it is on-screen for a set time. | The modern standard for ensuring you're paying for ads that had a real chance to be seen. |
Think of this table as your cheat sheet. These four terms form the foundation of how we measure and talk about campaign visibility.
An impression is a number, but reach is a person. One person can see your ad five times, resulting in five impressions but a reach of only one. Grasping this distinction is key to building an effective strategy.
Why Impressions Are a Critical Metric
While shiny metrics like clicks and conversions tend to get all the attention, impressions provide the context for everything else. They represent the very top of your marketing funnel, giving you a sense of the total potential audience your message was delivered to.
A high impression count can be a great indicator of strong brand awareness. On the flip side, low numbers might signal problems with your targeting or bidding strategy. Remember, they are fundamentally different from reach, which tracks unique users. If you want to dig deeper into that side of the coin, we have a whole guide on https://joinbrands.com/blog/how-is-reach-calculated/.
For a closer look at how impressions work on a specific platform, check out this great breakdown on What Do Impressions Mean on Pinterest. It offers some really valuable, platform-specific insights.
Finding Your Impression Data on Major Platforms
Before you can calculate anything, you have to get your hands on the raw data. And let’s be honest, every platform has its own quirky way of organizing things. Your final analysis will only be as good as the numbers you start with, so knowing exactly where to look is the first hurdle.
Let's walk through how to dig up these essential metrics on the big players in the ad space. The goal is to get comfortable navigating the analytics or ads manager sections of each network. While they all look a bit different, the core data is usually the same. A consistent process for pulling this info is what separates a clear-headed analysis from a complete mess.
Locating Impressions in Google Ads
When it comes to Google Ads, impressions are a metric they put front and center. The moment you log into your account, you land on the main dashboard which gives you a bird's-eye view of your campaigns.
From there, just click on the Campaigns tab in the left-hand menu. You'll see a big table loaded with performance metrics. Look for the column labeled “Impr.”—that’s it. This is your total impression count for whatever date range you've selected.
Here's a rookie mistake I've seen countless times: forgetting to check the date range. Always, always double-check the calendar in the top-right corner. Make sure it’s set to the right period, whether you're pulling numbers for a weekly check-in or a full quarterly review.
Finding Impression Data in Meta Business Suite
For your Facebook and Instagram ads, all the good stuff is tucked away inside the Meta Ads Manager. It's an incredibly detailed tool that breaks down performance across both platforms.
Once you’re in the Ads Manager, you’ll see a familiar table layout, much like Google Ads. The "Impressions" column should be visible by default. If for some reason it's not, customizing your view is easy:
- Find and click the Columns dropdown menu.
- Select Performance.
- Choose Customize Columns and just type "Impressions" into the search bar to find and add it to your report.
Taking a few minutes to customize your columns is a game-changer. It helps you build a dashboard that shows you exactly what you need to see, without all the extra noise.
Pro Tip: When you're in Meta's world, it's crucial to understand the difference between Impressions and Reach. Impressions tell you the total number of times your ad was shown, period. Reach tells you how many unique people saw it. Mixing these two up can completely skew your understanding of how a campaign is really doing.
Uncovering Impressions on LinkedIn Campaign Manager
Running professional campaigns? Your data lives in LinkedIn Campaign Manager. Finding your impression data here is just as straightforward.
After you hop into your ad account, you'll land on the main campaign dashboard. Like the others, it presents all your campaign data in a big table. The "Impressions" column is a standard metric, so it should be right there waiting for you. From this view, you can also filter down by campaign group, a specific campaign, or even an individual ad to get more granular with your numbers.
Getting comfortable pulling data from these platforms is a must-have skill for any marketer. If you want to go a bit deeper, check out our guide on how to track social media analytics. Nailing this first step ensures every calculation you make from here on out is built on solid, accurate ground.
Putting Your Impression Data to Work with a Few Key Formulas
Okay, so you’ve gathered all your raw impression data from the various platforms. Now what? By themselves, those big numbers are just vanity metrics. The real magic happens when you plug them into a few simple formulas to see what’s actually going on with your campaigns.
This is how you start answering the important questions. Are you paying a fair price to get in front of people? How do your ads stack up against the competition? More importantly, are your ads even interesting enough to earn a click? Let's break down the essential formulas that turn a pile of numbers into a clear story about your performance.
This infographic lays out the core formulas every marketer should have in their back pocket. It's all about understanding how your campaign is performing from both a visibility and a cost perspective.
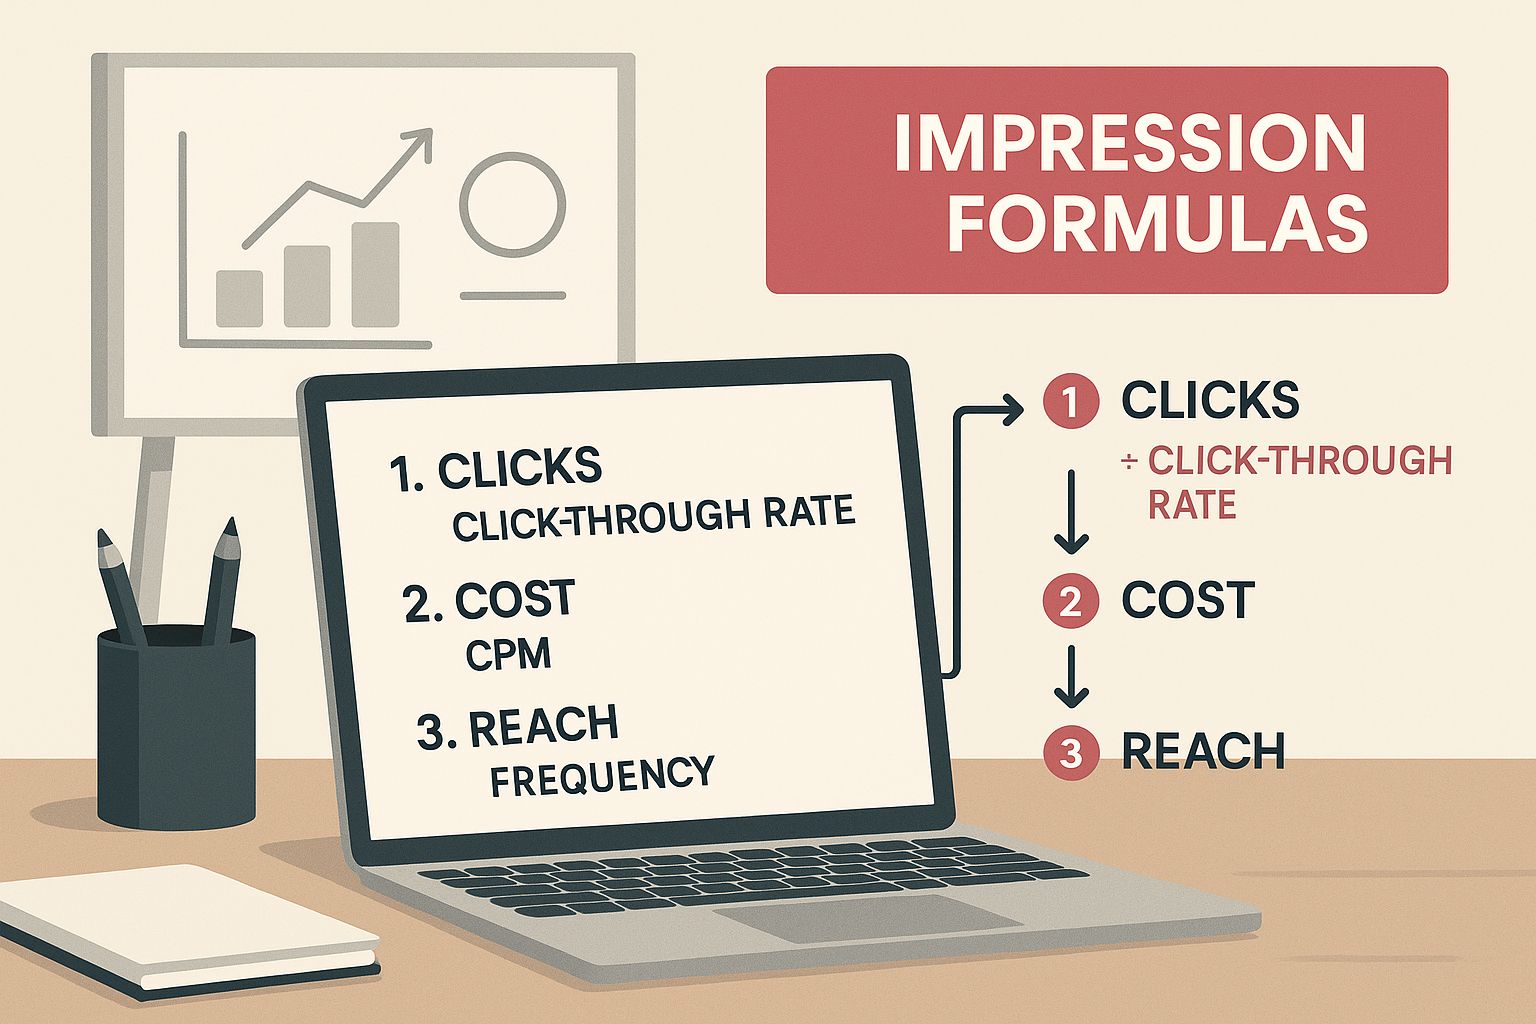
As you can see, metrics like cost, impressions, and clicks are all interconnected. Understanding how they relate to one another is the key to evaluating how efficient and impactful your campaigns really are.
Calculating Cost Per Mille (CPM)
The first and most common formula you’ll use is Cost Per Mille (CPM). "Mille" is just Latin for thousand, so this metric tells you the cost per thousand impressions. It has become the industry standard for measuring the cost-efficiency of any ad campaign focused on brand awareness.
The formula itself is pretty straightforward:
CPM = (Total Campaign Cost / Total Impressions) x 1,000
Let's say you spent $500 on a Facebook ad campaign and it generated 100,000 impressions. The math would look like this: ($500 / 100,000) * 1,000 = $5 CPM.
This means you paid $5 for every 1,000 times your ad was displayed. Simple, right? This single number makes it incredibly easy to compare the cost of getting eyes on your ads across different platforms, ad sets, or even entire campaigns.
From my experience, impressions are the bedrock of most advertising cost models. You'll see CPM rates fluctuate wildly, especially during peak shopping seasons like Black Friday when everyone is competing for the same ad space. This is a perfect example of how the demand for impressions directly impacts your budget. If you're curious about these trends, Gupta Media's 2025 social media CPM analysis is a great resource to dig into.
The Relationship Between Impressions and Click-Through Rate
While impressions tell you how many people saw your ad, Click-Through Rate (CTR) tells you how many people acted on it. It’s the percentage of viewers who were compelled enough by your ad to actually click on it.
The two metrics are fundamentally linked. You can't get a click without an impression first.
Here’s the formula:
- CTR = (Total Clicks / Total Impressions) x 100
So, if your ad got 50 clicks from 10,000 impressions, your CTR is 0.5%.
This is where the story gets interesting. If you have a ton of impressions but a really low CTR, that’s a red flag. It might mean your ad creative or your headline just isn't hitting the mark with your audience, even though plenty of people are seeing it.
Analyzing your CTR alongside your impression count helps you understand not just your visibility, but the actual quality and relevance of your message. These metrics are also the building blocks for calculating overall engagement, which gives you an even deeper view of how your audience is interacting. To take it a step further, you can use an engagement rate calculator to see how your content is truly performing beyond just clicks.
Turning Impression Data Into Smart Decisions
So you’ve pulled the raw numbers. You’ve even plugged them into a few formulas, and now you have a dashboard full of metrics like CPM and impression counts. But what do these figures actually tell you? This is where you graduate from just pulling data to making real strategic marketing decisions. A number without context is just noise; a number with context is intelligence.
Understanding the story behind your impression data is what separates a good marketer from a great one. It’s all about asking the right questions. Is that high impression count a sign of a perfectly targeted audience, or is it a warning that ad fatigue is about to set in? Let's get into how you can interpret these numbers to make smarter moves.
Decoding Your Impression Volume
A massive number of impressions can feel like a huge win, but you absolutely have to look deeper. High volume isn't always a good thing.
- Positive Signal: When you see high impressions paired with a strong Click-Through Rate (CTR), it suggests your ad creative is really connecting with a broad, yet relevant, audience. You've hit a sweet spot with your targeting and messaging.
- Potential Problem: On the flip side, if your impressions are through the roof but engagement is totally flat, you might be casting too wide a net. Your targeting could be way too broad, or worse, you're just hammering the same small group of people with the same ad over and over.
This is exactly where the relationship between impressions, reach, and frequency becomes critical. Reach tells you how many unique people saw your ad, while frequency is the average number of times each person saw it. High impressions with low reach means a high frequency—a perfect recipe for ad fatigue.
Don’t just chase a high impression count. You need to analyze it alongside reach and frequency. If one person sees your ad 10 times (10 impressions, 1 reach), it's far less valuable than 10 different people seeing it once (10 impressions, 10 reach).
Benchmarking Your CPM for Smarter Spending
Your Cost Per Mille (CPM) tells you how much you're paying for a thousand views. But how do you know if your $5 CPM is a bargain or a total ripoff? The answer is all in the benchmarking. You have to compare your costs against relevant industry averages to know if you’re paying a fair price for visibility.
For example, a CPM on the Google Display Network might float around $3, while a super-targeted LinkedIn campaign could easily top $30. These numbers vary wildly by platform, industry, and how specific your audience is.
The goal isn't just to find the absolute rock-bottom CPM. It's about finding the most cost-effective one for reaching the right audience. If you're paying a premium but getting in front of high-value customers who are likely to convert, that's money well spent. To truly understand the impact of your social media efforts, including impressions, consider mastering social media marketing analytics. This knowledge helps you put metrics like CPM into a much broader strategic context.
Avoiding Common Impression Calculation Mistakes

Even seasoned marketers can get tripped up by the nuances of impression data. It’s all too easy to see a massive number on a dashboard and draw the wrong conclusion. To make sure your analysis is actually telling the truth about your campaign's performance, you need to sidestep a few common pitfalls.
One of the biggest blunders is failing to look beyond served impressions. A served impression just means your ad was fired off to a webpage. It offers zero guarantee that a human ever had the chance to see it. Think about it: your ad could have loaded at the very bottom of a page the user never scrolled to.
That’s exactly why the industry has shifted its focus to viewable impressions (vCPM). With this metric, an ad only gets counted if a significant portion of it actually appears on-screen for a minimum amount of time. When you’re digging into your data, always prioritize viewable metrics, especially for display and video campaigns.
Confusing Impressions with Reach
This happens all the time. A marketer proudly reports millions of impressions, assuming that means they’ve reached millions of people. This is a fundamental—and costly—misunderstanding that can completely warp your strategy.
Impressions and reach measure two very different things.
- Impressions: This is the total number of times your content was displayed on a screen.
- Reach: This is the total number of unique people who saw your content.
So, if one person sees your ad ten times, that's 10 impressions but only a reach of 1. If you ignore this distinction, you'll end up thinking your campaign has a much wider audience than it actually does.
Before we go further, let's nail down the difference between these two critical metrics. It's a common source of confusion, but getting it right is fundamental to understanding your campaign's true impact.
Impression vs Reach: A Common Point of Confusion
| Attribute | Impressions | Reach |
|---|---|---|
| What It Measures | Total number of times an ad is displayed. | Total number of unique people who see an ad. |
| Focus | Volume and frequency of ad delivery. | Breadth and uniqueness of the audience. |
| Example | 1 person sees an ad 5 times = 5 impressions. | 1 person sees an ad 5 times = a reach of 1. |
| Key Question | How many times was my ad shown? | How many people did my ad get in front of? |
Seeing them side-by-side makes the distinction crystal clear. Impressions tell you about visibility and repetition, while reach tells you about the size of your audience. Both are important, but they serve very different analytical purposes.
Ignoring Audience Quality for Volume
Chasing a massive impression count without considering who is seeing your ads is another classic mistake. It's tempting to optimize a campaign for the lowest possible cost per thousand impressions (CPM), but this often comes at the expense of audience quality.
A million impressions served to a completely irrelevant audience is worth far less than ten thousand impressions delivered directly to your ideal customer profile.
An impression delivered to the wrong person is a wasted impression. Always prioritize the quality and relevance of your audience over the sheer volume of views. Your budget will thank you for it.
Overlooking Frequency Caps
This mistake is directly tied to the impression vs. reach problem. Without setting a frequency cap—a limit on how many times a single user sees your ad in a specific period—you risk annoying your audience into oblivion.
Seeing the same ad over and over again leads to "ad fatigue," where people start to ignore or even resent your brand.
A high impression count paired with low reach is a screaming red flag for high frequency. It means you're just hammering the same small group of people with your ad instead of expanding your audience. Thankfully, most ad platforms like Google Ads or Meta for Business allow you to set frequency caps to prevent this, helping you strike a healthier balance between visibility and user experience.
Got Questions About Impressions? We've Got Answers
Even after you get the hang of the formulas, a few questions about impressions always seem to pop up. It happens to everyone. Let's walk through some of the most common head-scratchers marketers run into when they start digging into the data.
Think of this as your go-to guide for clearing up those lingering points of confusion so you can interpret your numbers with confidence.
What Is a Good CPM?
Ah, the million-dollar question. And the honest-to-goodness answer is always: it depends.
There’s no magic number for a "good" Cost Per Mille (CPM). It’s a moving target that shifts wildly depending on the ad platform you're using, your specific industry, and just how niche your audience targeting is.
For example, you might see a CPM hovering around $3 on the Google Display Network for a really broad campaign. But flip over to a hyper-specific B2B campaign on LinkedIn, and that number could easily jump past $30.
The goal isn't to chase some mythical low CPM. Instead, you need to benchmark your performance against two key things:
- Your industry's average costs (for a general ballpark).
- Your own historical campaign data (this is the important one).
The most powerful benchmark for your CPM is your own past performance. Forget the broad industry stats for a minute. Focus on making your campaigns more cost-effective than they were last month or last quarter. That's real progress.
Why Don't My Impressions Match My Reach?
This is a classic mix-up, and it all comes down to understanding the difference between two fundamental metrics.
Impressions are the total count of how many times your ad was displayed on a screen. Reach, on the other hand, is the number of unique people who saw it. They are almost never going to be the same number.
Picture this: one person is scrolling through their Instagram feed and sees your ad five different times throughout the day. Your analytics will show five impressions but only a reach of one.
When you see a huge impression count with a much smaller reach, that's a dead giveaway that your frequency is high. It just means the same group of people is seeing your ad over and over again.
How Does Ad Fraud Affect Impression Counts?
Ad fraud is one of those nasty, behind-the-scenes problems that can make your impression numbers look amazing on paper, even if no real human ever laid eyes on your ad.
This usually happens when bots are programmed to crawl websites and trigger ad displays, racking up a massive number of fake impressions.
Not only does this waste your ad budget, but it completely skews your data, making your campaigns seem far more visible than they actually are. This is exactly why the industry has started focusing so heavily on viewable impressions (vCPM). By prioritizing viewability and using the fraud detection tools built into most ad platforms, you can make sure you’re paying for real visibility and keeping your campaign data clean.