


 How to Scale Content Creation: Proven Strategies to Grow
If you want to measure your content's performance effectively, you have to start by connecting it to real, tangible business objectives. Once you know what you’re trying to achieve, you can pick the key performance indicators (KPIs) that actually show you if your content is doing its job.
It’s about moving past surface-level vanity metrics and linking every single piece of content to a specific outcome, whether that's generating leads, growing your audience, or driving sales.
Table of Contents
Aligning Content Performance with Business Goals
Before you even glance at an analytics dashboard, your team needs a crystal-clear, shared definition of what "success" looks like. Just saying you want to "boost brand awareness" or "drive sales" is way too fuzzy.
Real measurement starts when you translate those big-picture ambitions into specific, quantifiable goals your content can directly impact. Every blog post, video, or social update needs to have a job to do.
You have to ask the hard questions. What role is this specific piece of content playing in the customer's journey? Is it meant to attract brand-new visitors who've never heard of you? Or is it supposed to nurture existing leads and nudge them closer to a purchase? The answer completely changes how you measure its success.
A top-of-funnel blog post tackling a common industry problem, for instance, should be judged by how well it attracts organic traffic and ranks for its target keywords. On the flip side, a bottom-of-funnel case study's success hinges on the number of demo requests or direct inquiries it brings in. If you don't make this strategic connection, you'll end up celebrating metrics that do nothing for your bottom line.
A classic mistake I see all the time is treating every piece of content the same. You can't penalize an article designed for brand discovery because it has a low conversion rate, just like you wouldn't judge a sales-focused landing page purely on its social shares. Context is everything.
Mapping Goals to Your Audience
Deeply understanding your audience's journey is the foundation of all of this. Take the time to map out the typical stages a customer moves through, from their first inkling of awareness all the way to purchase and becoming a loyal fan. Then, you can assign specific content and goals to each stage.
- Awareness Stage: The main goal here is to attract and educate. This is where blog posts, infographics, and social media updates shine. You’ll measure success with metrics like traffic, new users, and keyword rankings.
- Consideration Stage: Now you’re building trust and proving your value. Think case studies, webinars, and in-depth guides. Success is measured by lead generation, email sign-ups, and time on page.
- Decision Stage: This is all about closing the deal. Content includes product pages, free trial sign-ups, and customer testimonials. You're looking at conversion rates, demo requests, and ultimately, sales.
This visual gives you a snapshot of how different metrics contribute to overall growth, highlighting performance across the board.
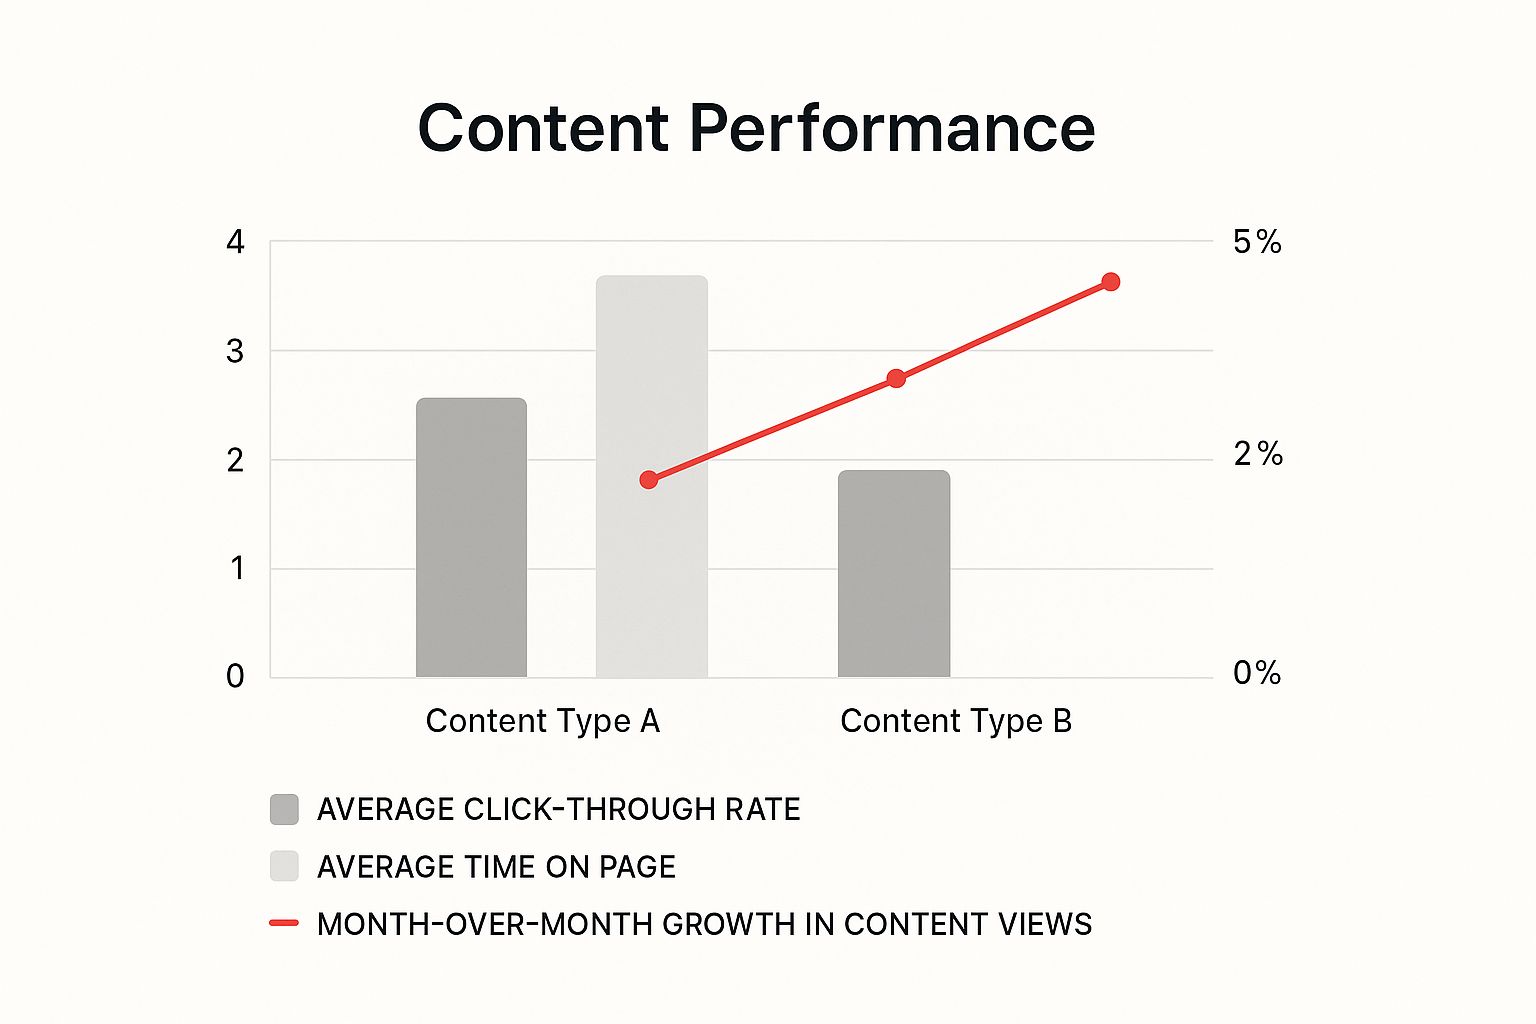
The data here makes it obvious: while some content types are fantastic for engagement (like time on page), others are much better at grabbing initial interest (click-through rate). This just reinforces why you need stage-specific goals.
Connecting these dots is crucial. The table below breaks down how you can map your business goals directly to the content KPIs that matter most.
Mapping Business Goals to Content KPIs
| Business Goal | Primary Content KPIs | Example Metric |
|---|---|---|
| Increase Brand Awareness | Traffic, Social Reach, Keyword Rankings, Backlinks | 5,000 unique visitors from organic search per month |
| Generate New Leads | Form Submissions, Email Subscribers, Gated Content Downloads | 150 new newsletter sign-ups from a blog post |
| Improve Audience Engagement | Time on Page, Bounce Rate, Comments, Social Shares | Average time on page of 3:30 for key pillar pages |
| Drive Sales & Revenue | Conversion Rate, Sales Attributed to Content, Demo Requests | 25 demo requests generated from a case study page |
| Boost Customer Loyalty | Repeat Visitors, Customer Lifetime Value (CLV), Churn Rate | 40% of monthly blog readers are returning visitors |
Using a framework like this ensures that you're not just creating content for the sake of it. You're building a strategic asset that directly contributes to the health and growth of your business.
The days of just tracking simple vanity metrics are long gone. The indicators that truly matter now—like time on page, click-through rate (CTR), conversion rate, and return on investment (ROI)—come together to paint a full picture of how your audience is responding and the impact you're having.
If you want to dig deeper, check out these 8 essential content performance metrics for 2025. By tying every piece of content back to a specific business outcome, you build a data-driven strategy that you can confidently prove the value of.
Selecting Metrics That Actually Matter

Alright, you've got your goals lined up. Now for the tricky part: choosing the right stats to actually track. It's incredibly easy to drown in a sea of data, and frankly, most of it is just noise. The real skill is separating the empty "vanity metrics" from the numbers that give you actionable insights into your content's performance.
Let's talk about the classic vanity metric: raw page views. Sure, it feels great to see a huge number there, but on its own, it tells you almost nothing. Did those visitors actually do anything? Did they stick around? A huge spike in views paired with a sky-high bounce rate usually means your headline was great but your content missed the mark entirely.
To avoid this trap, you need to focus on Key Performance Indicators (KPIs) that tie directly back to the business goals you just set. A smart way I've found to do this is to group your metrics by what they're trying to tell you. This approach helps you build a focused dashboard that cuts through the clutter and puts the decision-driving data front and center.
Audience Growth And Reach Metrics
Think of these as your top-of-funnel indicators. They answer a simple question: "Is my content attracting new people to my brand?" If these numbers are climbing, it's a good sign your content is discoverable and resonating with your target audience.
Here are the essentials:
- New Users: You can find this right in Google Analytics. It’s a pure measure of how many first-time visitors your content is bringing in. This is your audience expansion, plain and simple.
- Social Reach: This shows you the total number of unique people who laid eyes on your content across social media. It's a fantastic proxy for overall brand awareness.
- Follower/Subscriber Growth: A steady climb in social followers or email list subscribers is gold. It shows you're not just getting visitors, but building a loyal, owned audience you can talk to again and again.
Engagement And Quality Metrics
So, you got them to click. Now what? These metrics tell you if they actually liked what they found. High engagement is one of the strongest signals of content quality and proves you've connected with your audience on a deeper level.
Strong engagement metrics are the bedrock of any healthy content strategy. They're the proof that you're not just reaching people, but actually connecting with them. This is where you see the difference between a one-and-done visitor and a potential long-term customer.
Key engagement metrics to watch:
- Average Time on Page: A longer session usually means people are genuinely reading or watching what you've created.
- Bounce Rate: This is the percentage of people who hit your page and leave without clicking anything else. A high bounce rate can be a red flag, signaling a mismatch between what they expected and what you delivered.
- Comments and Social Shares: These are active forms of engagement. When someone takes the time to share or comment, it means your content was compelling enough to provoke a reaction. If you want to boost these, learning how to increase social media engagement is a great next step.
SEO And Conversion Metrics
At the end of the day, content has to support the business. Whether that's by boosting your search rankings or directly driving revenue, these KPIs connect your efforts to bottom-line results. For example, knowing how to measure the quality of your newsletter content helps you tie your email marketing directly to business outcomes.
Here are the bottom-line indicators you can't ignore:
- Keyword Rankings: Keep an eye on your position for target keywords in Google Search Console. This is a direct report card on your SEO effectiveness.
- Conversion Rate: This is the percentage of visitors who take the action you want them to, like filling out a lead form or downloading a guide.
- Assisted Conversions: This is a powerful, often-overlooked metric in Google Analytics. It shows you how many times a piece of content was part of a user's journey to conversion, even if it wasn't the very last thing they clicked.
- Lead Quality: Don't just count the number of leads. Go deeper. Track how many of those leads actually turn into qualified prospects and, eventually, paying customers.
By picking a healthy mix of metrics from each of these categories, you'll build a complete picture of your content's performance and know exactly what's working and what's not.
Building Your Content Analytics Toolkit

This Google Analytics report is a perfect example of what I'm talking about. You can see a clear breakdown of traffic sources, separating organic search from direct visits and referrals. A quick look tells you organic search is bringing in the most new users, which immediately highlights how crucial a solid SEO strategy is.
Okay, so you've got your goals mapped out and you know which KPIs to watch. Now it's time to actually build the machinery to track it all. Data is literally everywhere, but turning that noise into a clear story about your content's performance means building a smart analytics toolkit. This isn't just about collecting tools; it's about making them work together to give you the full picture, from the first click to a signed contract.
For most of us, the absolute cornerstone is Google Analytics (GA4). It's the powerhouse for figuring out what people are doing once they land on your site. Don't just get bogged down by the main traffic numbers. Your real job is to build custom reports and dashboards that zero in on the specific KPIs you chose earlier. For instance, you could set up a report that only shows new users from organic search who visited your pillar pages and stuck around for more than two minutes. That’s where the real insights are.
Uncovering Search Visibility and User Intent
Your next must-have is Google Search Console (GSC). Think of it this way: while GA4 tells you what happens on your site, GSC tells you how people find your site through Google Search in the first place. It's your direct line to understanding your search performance.
GSC gives you some incredibly valuable data points:
- Impressions: How many times your content showed up in search results.
- Clicks: The number of people who actually clicked on your link.
- Click-Through Rate (CTR): The percentage of impressions that turned into a click. This is a huge signal for how well your titles and meta descriptions are grabbing attention.
- Average Position: A look at where your content generally ranks for certain search queries.
Digging into the search queries people use to find you is like striking gold. It reveals what they really want. If you see an article ranking for terms you didn't expect, that’s a massive opportunity to go back and refine that content to better match exactly what your audience is looking for.
Connecting Content to Revenue
To really get the C-suite on board, you have to connect your content directly to revenue. This is where your Customer Relationship Management (CRM) platform, whether it's HubSpot, Salesforce, or another tool, becomes an indispensable part of your toolkit.
By integrating your CRM with your web analytics, you can trace a user's entire journey—from the first blog post they read, to becoming a qualified lead, and finally, to becoming a paying customer. This setup allows you to put real dollar amounts next to your content efforts. You can finally answer those critical questions like, "How many leads who downloaded our e-book ended up buying something?" or "What was the total contract value from customers who first found us through that webinar?"
This integration is how you prove content ROI. It shifts the conversation from, "Our blog got 10,000 views," to, "Our blog influenced $50,000 in new business last quarter." That's a story that gets everyone's attention.
And to make sure all this tracking is accurate, there's one foundational skill you need: learning about efficient UTM tag creation. Properly tagged URLs are what tell your analytics tools exactly where traffic came from—be it a social post, an email newsletter, or a paid ad. It gives you that crystal-clear view of what's working and what's not.
Analyzing Your Data to Uncover Actionable Insights
Collecting data is easy. The real magic happens when you figure out what it all means. You have to learn how to read the story your analytics are telling you. This is about moving past just reporting numbers and starting to connect the dots, spot the patterns that matter, and draw conclusions that actually make your content better.
True analysis is all about asking "why." Why did the time on page for that one article suddenly tank? What caused that weird traffic spike from a referral source you've never seen before? Answering these questions is what turns you from a data reporter into a data-driven strategist.
Looking Beyond the Surface Numbers
Effective analysis starts the moment you slice and dice your data. Instead of just staring at your overall bounce rate, try comparing the bounce rate of your blog posts against your product pages. A simple comparison like that can instantly tell you a ton about user intent and how well different types of content are working.
Don't just track total traffic, either. Break it down by source. Is your organic traffic growing month-over-month? Is a specific social channel sending you users who actually stick around? This is the context you need to make smart decisions.
For example, you might notice that while your overall social media traffic is flat, visitors from LinkedIn spend twice as long on your site and convert at a much higher rate. That’s a huge insight. It tells you to double down on your LinkedIn strategy—a conclusion you’d completely miss by only looking at the big, aggregate number.
Investigating Anomalies and Trends
Your data will always have surprises—sudden spikes or drops that make no sense at first glance. These aren't errors; they're your biggest learning opportunities. When you spot one, it’s time to put on your detective hat.
Think about these real-world scenarios:
- A Sudden Traffic Spike: Did another site link to you? Did a popular newsletter feature your article? Dig into your referral traffic report to find the source and figure out why they sent people your way.
- A Drop in Conversions: Did you recently tweak a call-to-action button? Is a form on your landing page broken? Check for any recent site updates or technical glitches that could be the culprit.
- High Engagement on an Old Post: Is a post from two years ago suddenly getting traction? It might be ranking for a new, trending keyword. Use Google Search Console to see what search queries are bringing people in.
Don't ever dismiss weird data points as flukes. Investigate them. A single anomaly can often reveal a critical flaw in your user experience or a brand-new content opportunity you never would have thought of.
This focus on engagement is becoming the new standard. Marketers are realizing that how users interact with content is a much better gauge of success than just counting eyeballs. In fact, recent data shows that 53% of marketers now track social media engagement, and an equal percentage monitor website engagement. This is a clear shift toward valuing genuine interaction over simple views.
Comparing Content to Find What Resonates
One of the most powerful things you can do is pit your content against itself. Comparing the performance of different pieces helps you identify the formats, topics, and writing styles that truly connect with your audience.
Set up a simple framework for a content audit. Once a quarter, pull your top- and bottom-performing content based on metrics like traffic, engagement, and conversions.
Then, ask the important questions:
- What do our best articles all have in common? (e.g., listicles, case studies, original research)
- Which topics consistently bring in the most leads?
- Do videos or blog posts work better for explaining complex ideas?
This process is how you find out what's working so you can create more of it. To pull all these findings together and present them in a way that makes sense, a solid social media analytics report template can be a lifesaver. It helps you turn raw data into a clear story, making it easier to explain what’s working, what isn’t, and most importantly, why.
Turning Performance Insights Into Content Strategy

Collecting data is only half the battle. The real magic happens when you turn those numbers into smarter decisions that actually grow your brand. This is where you close the loop, using your analysis to build a concrete plan that constantly levels up your content.
You’re essentially creating a powerful feedback loop. Performance data feeds directly into your editorial calendar, which means your strategy is always evolving based on hard evidence—not just guesswork. You'll know exactly what resonates with your audience and what drives your bottom line.
Prioritize and Optimize Underperforming Content
Your analytics will always point out content that isn't pulling its weight. Don't see these as failures. Instead, look at them as opportunities just waiting for a second chance.
Start by digging into why they're underperforming. Is an article getting decent traffic but has a sky-high bounce rate? That tells me the headline and meta description are working, but the content itself isn't delivering on the promise.
A quick look at Google Search Console can be a goldmine here. Check the search queries leading people to that page. You might find they're looking for something just slightly different from what you've offered. Often, a simple rewrite to better match their intent, add more depth, or just make it easier to read can turn a dud into a stud.
Don’t just let old content die. A strategic content refresh can be far more efficient than creating something new from scratch. I’ve personally seen posts double their organic traffic after a targeted update based on performance data.
Double Down on What Works
Just as important as fixing the duds is identifying your superstars. Pinpoint the content formats and topics that consistently crush it in terms of engagement, leads, or traffic. These are your proven winners, and the data gives you a clear green light to make more of them.
- High-Performing Formats: If you notice your case studies generate the most qualified leads, make them a regular feature. If short-form videos get the most shares, it's time to invest more resources there.
- Resonant Topics: Does every article you write on a certain theme rank well and keep readers glued to the page? That's your signal to build a full-blown topic cluster around it. Create a comprehensive pillar page and a series of related posts to really own that niche.
This data-first approach takes the guesswork out of content planning. For instance, if you're seeing high engagement from creators on a specific platform, maybe it's time to explore new avenues. You can get more ideas on this in our guide to the TikTok affiliate programme.
By analyzing what’s already a hit, you can confidently decide where to put your time and budget for the biggest impact. Your content calendar will be packed with pieces that are primed for success from the get-go.
Still Have Questions About Measuring Your Content?
Even with a solid plan, you're going to hit a few bumps when you start digging into the data. That’s totally normal. Let's walk through some of the most common questions and sticking points I see marketers run into. Getting these sorted out will keep you from getting lost in the weeds.
How Often Should I Actually Be Looking at My Metrics?
This is a big one. The honest answer? It completely depends on the metric and your own business rhythm. The worst thing you can do is check everything, every single day. You'll drive yourself crazy.
For the big-picture stuff—think overall organic traffic, how many leads you're generating, and general keyword ranking trends—looking at this on a monthly or quarterly basis is your best bet. This timeframe is long enough to reveal real patterns and smooth out the random daily spikes and dips that don't mean much.
On the other hand, when you launch a specific campaign or a brand-new piece of content, you need to be a bit more hands-on. I recommend checking engagement metrics like time on page, social shares, and comments weekly. This gives you a chance to react quickly if a piece is falling flat. If nobody's biting, you can make adjustments before it's too late.
The real key here is consistency. Set a schedule that works for you, like a recurring monthly content review meeting, and stick to it.
What’s the Real Difference Between a Metric and a KPI?
I get this question all the time, and it’s a fair one because the terms get thrown around interchangeably. But the distinction is super important for staying focused.
A metric is just a data point. It's any standard of measurement. Page views, likes, downloads, bounce rate—those are all metrics. You could track hundreds of them if you wanted to (but please don't).
A Key Performance Indicator (KPI) is different. It’s a specific metric you’ve hand-picked because it directly shows if you're getting closer to a major business goal.
Think of it this way: While total page views is a metric, 'new organic visitors to top-of-funnel blog posts' could be a KPI if your goal is to increase brand awareness. All your KPIs will be metrics, but only a handful of your metrics are important enough to be called KPIs.
How Do I Measure ROI for My Top-of-Funnel Content?
This is the million-dollar question, isn't it? Measuring the return on investment (ROI) for something like a blog post or an infographic—content that isn't directly asking for a sale—can feel like trying to nail Jell-O to a wall. But it's not impossible.
You just have to look for the right clues. The trick is to use proxy metrics that prove its value further down the line.
Instead of looking for a direct sale from that one blog post, track how it influences the customer's journey. Here are a few things to watch:
- Brand Search Volume: Are more people searching for your brand name directly? Tools like Google Trends can help here.
- Backlinks: How many other credible websites are linking back to your content? This is a huge vote of confidence.
- Assisted Conversions: This is a goldmine. Dig into your Google Analytics to see how many times that blog post was a touchpoint in a journey that eventually led to a conversion.
This approach helps you paint a clear picture of how your top-of-funnel content is building the trust and authority needed to close deals later. It proves the value, even without that immediate "buy now" click.
Here at JoinBrands, we know that finding the right creators is the first step to producing content that actually performs. Our platform is built to connect you with a network of over 250,000 influencers and UGC creators, making it simple to generate authentic content that genuinely drives engagement and boosts sales.
See how JoinBrands can level up your creator marketing strategy.