


 Your Ultimate Guide to Choosing an AI Video Maker
Great social media reporting isn't about dumping a bunch of data into a spreadsheet. It's about telling a story—the story of how your campaign actually moved the needle for the business. It’s how you prove your work has value and figure out what’s clicking with your audience so you can do more of it.
Table of Contents
Setting the Stage for Insightful Reporting
Honestly, a powerful report is made long before you even think about pulling numbers. It all starts with a rock-solid strategy that links every single social media action back to a real business outcome. If you skip this part, you'll end up with a report full of fluff metrics that look nice but don't give anyone any real direction.
It all boils down to this: your social media goals have to mirror your bigger business goals. Let’s say the company wants to boost online sales by 15% this quarter. Your social campaign goal shouldn't be something vague like "get more engagement." It needs to be specific, like "drive qualified traffic to product pages" or "increase conversions from social channels." That direct connection is what makes your reporting truly meaningful to the people who sign the checks.
Defining Your Key Performance Indicators
With your objectives locked in, the next step is to pick the Key Performance Indicators (KPIs) that will actually measure your success. And no, I'm not talking about vanity metrics like follower count. We need quantifiable numbers tied directly to your goals.
Running a lead generation campaign? You should be laser-focused on metrics like cost per lead (CPL), landing page conversion rate, and maybe even lead quality scores. If it's a brand awareness play, then you'll care more about things like reach, share of voice, and video view-through rate.
Key Takeaway: The real gap between a good report and a great one is context. A report that just says "we got 500,000 impressions" is just data. A report that explains, "we reached 500,000 people in our target demographic, which led to a 20% jump in website traffic from new users and brought in 50 qualified leads," tells a story of business impact.
Before you even launch, getting these foundational pieces straight is non-negotiable. It’s what separates a report that gets a nod from one that gets you more budget.
Pre-Campaign Reporting Essentials
Here's a quick reference table to make sure you've got all your ducks in a row. These are the core elements you need to define before launching any campaign to ensure your reporting is both accurate and insightful.
| Checklist Item | Why It's Critical | Real-World Example |
|---|---|---|
| Business Objective | Connects social efforts to company-wide goals, proving ROI. | "Increase Q3 e-commerce revenue by 10%." |
| Campaign Goal | A specific, measurable social media outcome that supports the business objective. | "Drive 5,000 link clicks to the new product collection page." |
| Primary KPIs | The handful of metrics that directly measure the success of your campaign goal. | Link Clicks, Cost Per Click (CPC), Add to Carts from Social. |
| Target Audience | Ensures your message reaches the right people, not just anyone. | "Females, ages 25-40, in the US, interested in sustainable fashion and wellness." |
| Platform Selection | Focuses your budget and effort where your target audience is most active. | Instagram and Pinterest for a visual product; LinkedIn for B2B services. |
Nailing down these essentials from the get-go turns reporting from a chore into a strategic tool.
Choosing the Right Platforms
Finally, all this prep work makes choosing your social platforms a no-brainer. Every platform has its own vibe and audience. A B2B software company trying to generate high-quality leads will almost certainly pour its resources into LinkedIn. On the flip side, a direct-to-consumer fashion brand launching a new collection will live on the visual, influencer-heavy feeds of Instagram and TikTok.
When you pick the right channels, you’re not just simplifying your reporting; you're concentrating your firepower where it will make the biggest impact. If you want to see a masterclass in this, look at how top brands use automotive social media marketing strategies—they are experts at targeting very specific niche audiences.
Putting in this foundational work is what transforms your reporting from a boring data-dump into a compelling story about your campaign's real value.
Choosing Your Metrics and Reporting Toolkit
Alright, you've got your goals locked in. Now comes the hard part: figuring out what to actually measure. Effective social media campaign reporting isn't about tracking every single data point you can find; it’s about zeroing in on the numbers that really matter.
So many marketers get hung up on vanity metrics. You know the ones—raw follower counts or page likes that look great in a presentation but don't tell you if you're actually building a real community or, more importantly, making money.
Actionable metrics, on the other hand, connect directly to what your business is trying to achieve. These are the numbers that show you the true pulse of your campaign and help you make much smarter decisions down the line.
From Vanity Metrics to Valuable Insights
Let's make this real. A big jump in followers feels like a win, right? But if none of those new people ever interact with your posts or click over to your website, what's their actual value? The real story is always in the metrics that track what people do.
Instead of just celebrating likes, shift your focus to metrics like these:
- Engagement Rate: This is huge. It shows you the percentage of your audience that's actually interacting with your content. A high rate is a clear sign that what you're posting is hitting the mark.
- Cost Per Acquisition (CPA): For any campaign focused on sales, this is the bottom-line metric. It tells you exactly how much you had to spend to get one new customer. No hiding from this number.
- Click-Through Rate (CTR): This tells you how many people saw your post and were interested enough to click your link. It’s a powerful signal that your creative and your copy are working together.
The crucial shift is moving from "How many people saw our brand?" to "What did those people do next?" That's where you find the insights that justify budgets and guide future strategy.
Think about it this way: a campaign that gets 1,000 clicks at a cheap $0.50 Cost Per Click (CPC) but leads to zero sales is a failure. Meanwhile, a different campaign might only get 200 clicks at a more expensive $2.00 CPC but drives 20 conversions. The first report might look good on the surface, but the second one actually made the business money.
Selecting Your Reporting Tools
Once you've figured out what to track, you need to decide how you're going to track it. Your toolkit can be anything from the free, built-in analytics on each platform to more advanced third-party software.
Native Platform Analytics
Platforms like the Meta Business Suite, LinkedIn, and TikTok offer a ton of data for free. They're fantastic for getting a really granular look at how you're performing on a single channel.
- Pros: They’re completely free, offer incredibly detailed platform-specific data, and are always current with the latest features.
- Cons: It's a pain to pull data from each platform one by one. Comparing performance across different channels is tough, and you have very limited options for customizing your reports.
Third-Party Reporting Platforms
This is where tools like Sprout Social, Hootsuite, or Agorapulse come in. They pull all your data from every social channel into one clean dashboard. For anyone managing more than a couple of accounts, this is a total game-changer.
- Pros: You get a centralized view for cross-channel analysis, much better customization and visuals, and can save a ton of time with automated reports.
- Cons: They can get pricey. There's often a bit of a learning curve, and they might not have every single niche metric you can find in the native tools.
The right tool for you really comes down to your team's size, budget, and how complex your campaigns are. A small startup might get by just fine with native analytics and some well-organized spreadsheets. But an agency juggling ten clients will find a paid platform is essential for doing efficient social media campaign reporting. Your toolkit should grow with you, but its main job is always the same: to turn a mountain of data into clear, actionable intelligence.
How to Build Your Campaign Report
Alright, let's move from theory to actually building the thing. This is where the real storytelling begins. A killer report doesn't just throw numbers at people; it frames them in a way that's instantly understandable and compelling for anyone who reads it, from a fellow marketer all the way up to the CEO.
The structure of your report is everything. It needs to walk the reader through a logical story, starting with the most important takeaways and then digging into the details that back them up. This approach respects your stakeholders' time and makes sure your key messages land with maximum impact.
This task has gotten way more complex. The number of social media users worldwide is projected to hit around 5.42 billion, with the average person juggling 6.83 social networks every month. That fragmentation is precisely why clear, consolidated reporting is no longer a "nice to have"—it's a must-have.
Start with the Executive Summary
Always, always start your report with a tight executive summary. This isn't just a warm-up; it's the entire story in a nutshell. It should immediately answer the big questions: What was the goal? Did we hit it? What were the standout wins?
Think of it as the highlight reel. For example, you might write something like: "Our Q2 'Summer Glow' campaign set out to boost online sales by 15% and absolutely crushed it, delivering a 19% revenue lift. This was driven by a super-effective Instagram Reels strategy that came in at a 25% lower Cost Per Acquisition than our benchmark."
This summary gives stakeholders the bottom-line results right away, making the rest of the report pure context for this success.
Visualize Your Data for Clarity
Let's be honest: nobody wants to squint at rows in a spreadsheet. This is where data visualization is your best friend. Using clean, simple charts and graphs is non-negotiable for making complex data easy to digest.
Your goal is to match the right visual to the right metric:
- Line graphs are perfect for showing trends over time, like follower growth or daily website clicks.
- Bar charts are brilliant for comparing values, like the engagement rates across different ad creatives.
- Pie charts are great for showing how something breaks down, like your social media traffic by platform.
This workflow really shows the process of turning raw numbers into a polished report.
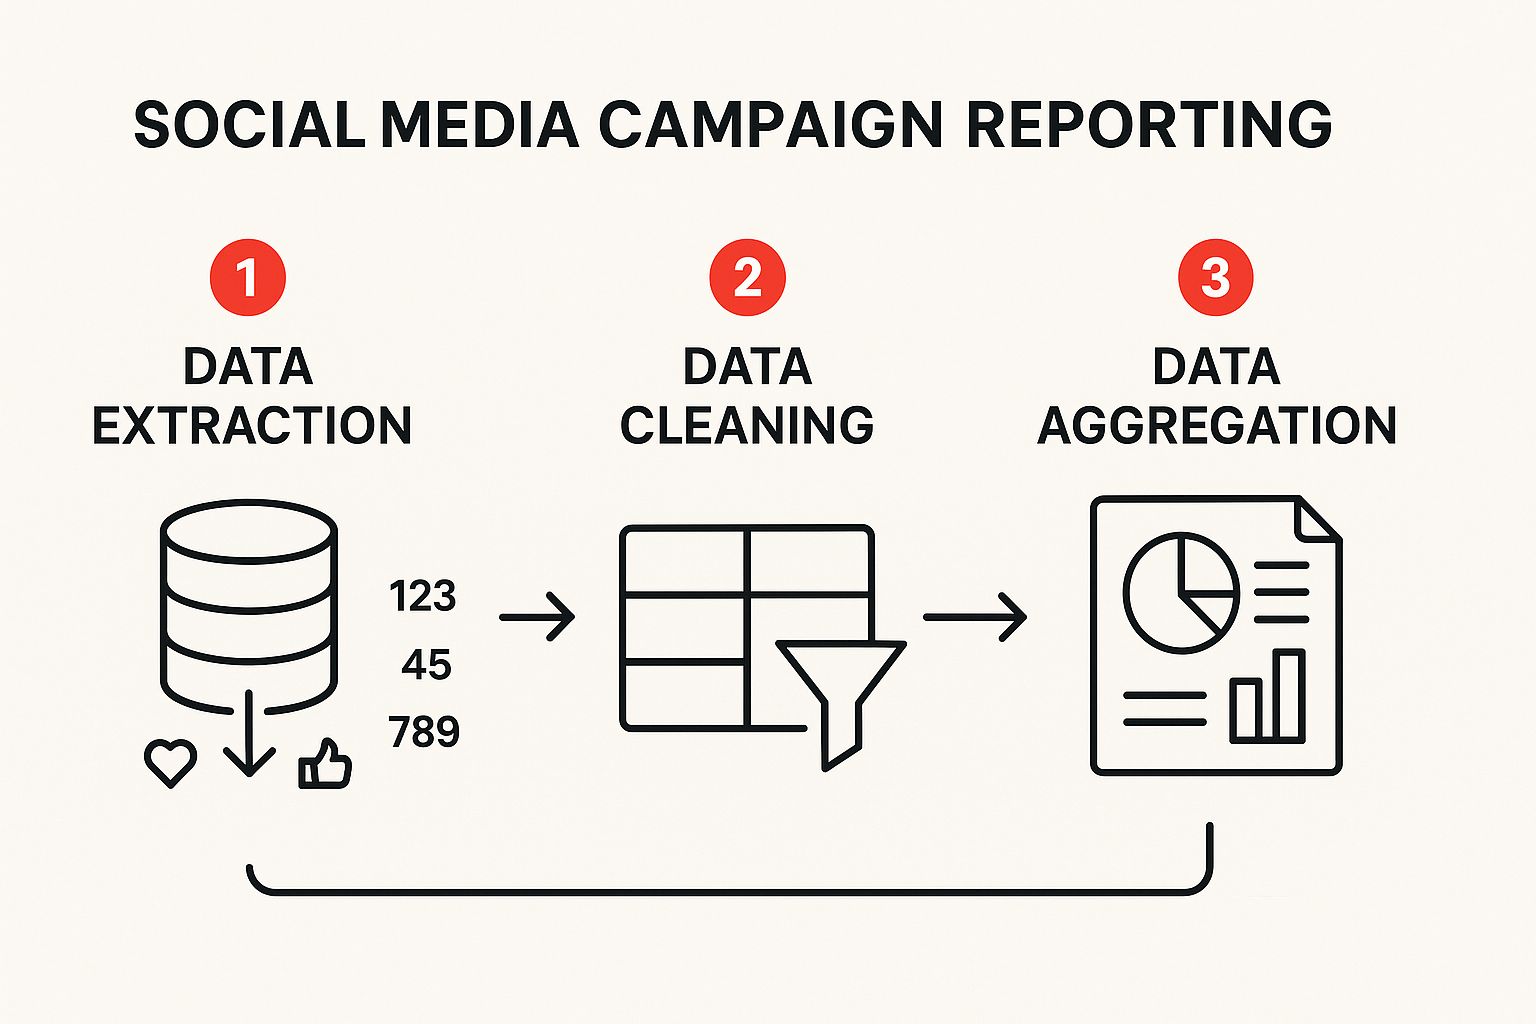
The key takeaway here is that reporting is a multi-step game. Just pulling data isn't enough. The cleaning and aggregation stages are where you turn messy metrics into something truly meaningful.
Crafting the Narrative Around Your Numbers
This is the most critical part of effective social media campaign reporting. After you've shown the "what" (the data), you have to explain the "why" and the "so what." Every data point needs a short, insightful story to go with it.
Don't just show a spike in engagement; explain why it happened. Was it a specific viral post? A new content format we tested? An influencer collaboration that popped off? Connecting your team's actions to the results is how you prove you're thinking strategically.
For instance, instead of just stating, "Engagement rate was 4.2%," you’d add context: "Our engagement rate hit 4.2%, beating our 3% target. This was largely driven by our user-generated content series, which saw a 30% higher comment rate than our typical brand posts. This tells us our audience is hungry for authentic, peer-created content."
This level of analysis turns your report from a simple data dump into a strategic document that offers clear direction for what to do next. For some hands-on help with structuring your reports to pull out these kinds of insights, check out these excellent social media analytics report template ideas.
Turning Data Into Actionable Insights
A report that just sits in a folder collecting digital dust is a missed opportunity. I've seen it happen countless times. The real magic of social media campaign reporting starts when you stop just presenting data and begin interpreting it to find the story hidden in the numbers.
This is how a backward-looking document transforms into a forward-thinking roadmap for your next big win.
Your first job is to become a trend-spotter. Look for the patterns in your performance over time. Did your engagement rate consistently climb week-over-week? Or did your reach suddenly tank after you switched up your posting schedule? Seeing these trends helps you grasp the bigger picture of what’s clicking with your audience and what’s falling flat.
And don't just hunt for good news. Pay close attention to anomalies—those sudden spikes or dips that break the pattern. A crazy surge in website traffic from a single post is an anomaly you have to dissect. What was different about it? The visual? The call-to-action? The copy? These outliers often hold the most valuable lessons.
From Observation to Optimization
Once you've spotted some trends and flagged a few anomalies, it's time to get your hands dirty with testing. Real, meaningful optimization comes from a continuous cycle of hypothesizing, testing, and learning. You don't need a massive budget or a data science degree to get started, either.
Simple A/B tests can give you incredibly powerful insights. Here’s how I’ve seen it work wonders:
- Ad Creative: Run the same ad copy and targeting but with two different images or videos. Does a lifestyle photo outperform a simple product shot? Does a fast-paced Reel get more clicks than a static graphic? Test it.
- Copywriting: Use the exact same visual but test two different headlines or CTAs. You might be surprised to find that a direct "Shop Now" converts way better than a softer "Learn More" for a specific audience.
- Audience Targeting: Test the same ad creative and copy on two distinct audience segments. I’ve seen campaigns where a lookalike audience based on past purchasers blew a broad, interest-based group completely out of the water.
Key Insight: Treat every single campaign as a chance to learn something new. The goal isn't just to hit your targets; it's to walk away with a clearer understanding of what your audience actually wants. This iterative process is what separates stagnant brands from those that consistently grow.
Uncovering Insights with AI-Powered Tools
To really get an edge, you have to look beyond your own data. This is where AI-powered social listening tools become absolute game-changers. They let you tune into the broader conversation happening around your industry, your competitors, and your brand.
These tools go way beyond just tracking metrics. They analyze sentiment, identify emerging trends, and can even surface competitor weak spots you can exploit.
This tech is providing a serious advantage. Marketers using these AI tools report having up to twice the confidence in their social media marketing ROI. This is especially true for platforms like Facebook and Threads, where social listening boosted ROI confidence to 67% and 30%, respectively. You can dig into more of these social media insights yourself.
By understanding what customers are saying in real-time, you turn your social media campaign reporting from a simple performance review into a powerful strategic intelligence briefing.
Proving ROI and Communicating Value

When the dust settles on any campaign, your report needs to answer one simple, brutal question: “So, was it worth it?” This is where we stop talking about vanity metrics and start connecting the dots between social media activity and real-world business results.
This is arguably the most critical piece of the entire reporting puzzle. It’s how you justify your budget, prove your strategy was the right call, and get the green light for your next big idea. Without a clear line to Return on Investment (ROI), even the most buzzed-about campaign can look like a costly distraction.
Calculating Your Campaign's Return
The most direct path to proving value is through attribution. If you’ve set up your UTM parameters and tracking pixels (like the Meta Pixel or TikTok Pixel), you can trace sales directly back to a specific post or ad. The math is simple: (Revenue from Social – Social Media Costs) / Social Media Costs.
But let’s be real—not all value comes from an immediate "buy now" click. Brand-building campaigns create long-term equity that's harder to pin down on a spreadsheet but is absolutely vital. For these, we have to get creative and look at value from different angles.
Consider cost savings, for example. If your team is crushing it with customer service on social, you can calculate the cost savings compared to handling those same queries through a pricier call center. Resolving 100 issues on X (formerly Twitter) is a lot cheaper than fielding 100 phone calls, and that’s a direct value-add that goes beyond sales.
Key Takeaway: The pressure to show financial impact is mounting. The 2025 Sprout Social Index™ found that 65% of marketing leaders expect to see direct links between social campaigns and business goals. On top of that, 52% want to see quantifiable cost savings. The problem? Only 30% of marketers feel confident they can actually measure social media ROI, which points to a huge skills gap.
To get a fuller financial picture, I also recommend looking into broader metrics like the Marketing Efficiency Ratio (MER). It helps paint a more complete picture of how your marketing dollars are performing as a whole.
Speaking the Language of Stakeholders
The final step is all about communication. A generic, one-size-fits-all report is a recipe for disaster. Different people in your organization care about different things, so you need to tailor your delivery to the audience.
Think of it this way:
For the CMO: They operate at 30,000 feet. Focus on the big-picture strategic wins. Connect your results to high-level business goals like market share, brand equity, and customer lifetime value. This is where metrics like ROI, CPA, and share of voice really shine.
For the Sales Team: They live and die by their quotas. They want to know one thing: how is social helping them sell? You need to highlight the number of qualified leads you generated, point out specific social conversations that blossomed into sales opportunities, and share killer customer testimonials you found on social.
For the Content Team: These are your creative partners. They need to know what’s actually connecting with the audience. Give them the goods: top-performing posts, which formats are killing it, and what messaging themes are getting the most love. Your job is to provide clear, data-driven recommendations for what they should build next.
When you frame your results in a language that aligns with each department's goals, you make sure your campaign's success is understood and celebrated by everyone who matters.
Common Reporting Questions Answered
Even with a solid process, some questions seem to pop up every single time you sit down to build a social media campaign report. I've seen it time and again. Getting clear on these common sticking points will not only streamline your workflow but also give you more confidence when you present your findings.
Let's dig into some of the most frequent challenges I see marketers wrestle with.
One of the biggest questions is always about timing: how often should you actually run these reports? The honest answer is, it depends entirely on your campaign's speed and goals. For a fast-paced, high-spend paid ad campaign, you'll want to pull numbers weekly or even twice-weekly. You have to be ready to make quick optimizations to avoid burning through your budget.
But for longer-term brand awareness efforts, a monthly check-in is usually plenty to track progress without getting bogged down in meaningless daily fluctuations. The most important thing is to set expectations and agree on a reporting cadence with stakeholders before you launch. And no matter what, always produce a final, comprehensive wrap-up report after the campaign concludes. This is where you'll analyze overall performance and find the gold for your next strategy.
Report Versus Dashboard: What Is the Difference?
It’s easy to use these terms interchangeably, but they serve very different functions in practice.
Think of a dashboard as the live speedometer in your car—it gives you a real-time, at-a-glance view of your most critical metrics. It’s perfect for daily monitoring and quick "health checks" to make sure nothing is on fire.
A report, on the other hand, is a static analysis created at a specific point in time. It goes much, much deeper.
A dashboard shows you what is happening. A report explains the why behind the data, the so what of the insights, and the what's next of your strategic recommendations. It tells the complete story that a live dashboard simply cannot.
This distinction is crucial. You'll save yourself a lot of headaches by communicating this clearly to your team and leadership. Dashboards are for monitoring; reports are for analysis and strategic planning.
Reporting on Non-Sales Campaigns
How do you prove value when a campaign isn't designed to drive direct sales? This is a classic hurdle for brand awareness or community-building initiatives. The secret is to tie your reporting back to the specific, non-financial goals you set from the very beginning.
For an awareness-focused campaign, your report should be highlighting metrics like:
- Reach and Impressions: How many unique people actually saw your content.
- Video Completion Rates: What percentage of viewers watched your video all the way through? This signals high interest.
- Share of Voice: How does your brand's conversation volume stack up against your competitors?
If you're focused on community engagement, you'll want to track metrics like comments, shares, saves, and the growth rate of your audience. The goal is to paint a clear picture of how building brand affinity and an active community creates undeniable long-term business value, even if it doesn't lead to a sale today.
Ready to stop guessing and start getting real results from your content? JoinBrands connects you with over 250,000 creators to produce authentic, high-impact content that amplifies your social presence and accelerates sales. Streamline your entire workflow—from finding the perfect influencer to launching Spark Ads—all on one platform. Start your campaign today on JoinBrands.