


 How to Going Live on TikTok: Easy Tips for Beginners
Table of Contents
Understanding What Reach Really Means in Your Marketing
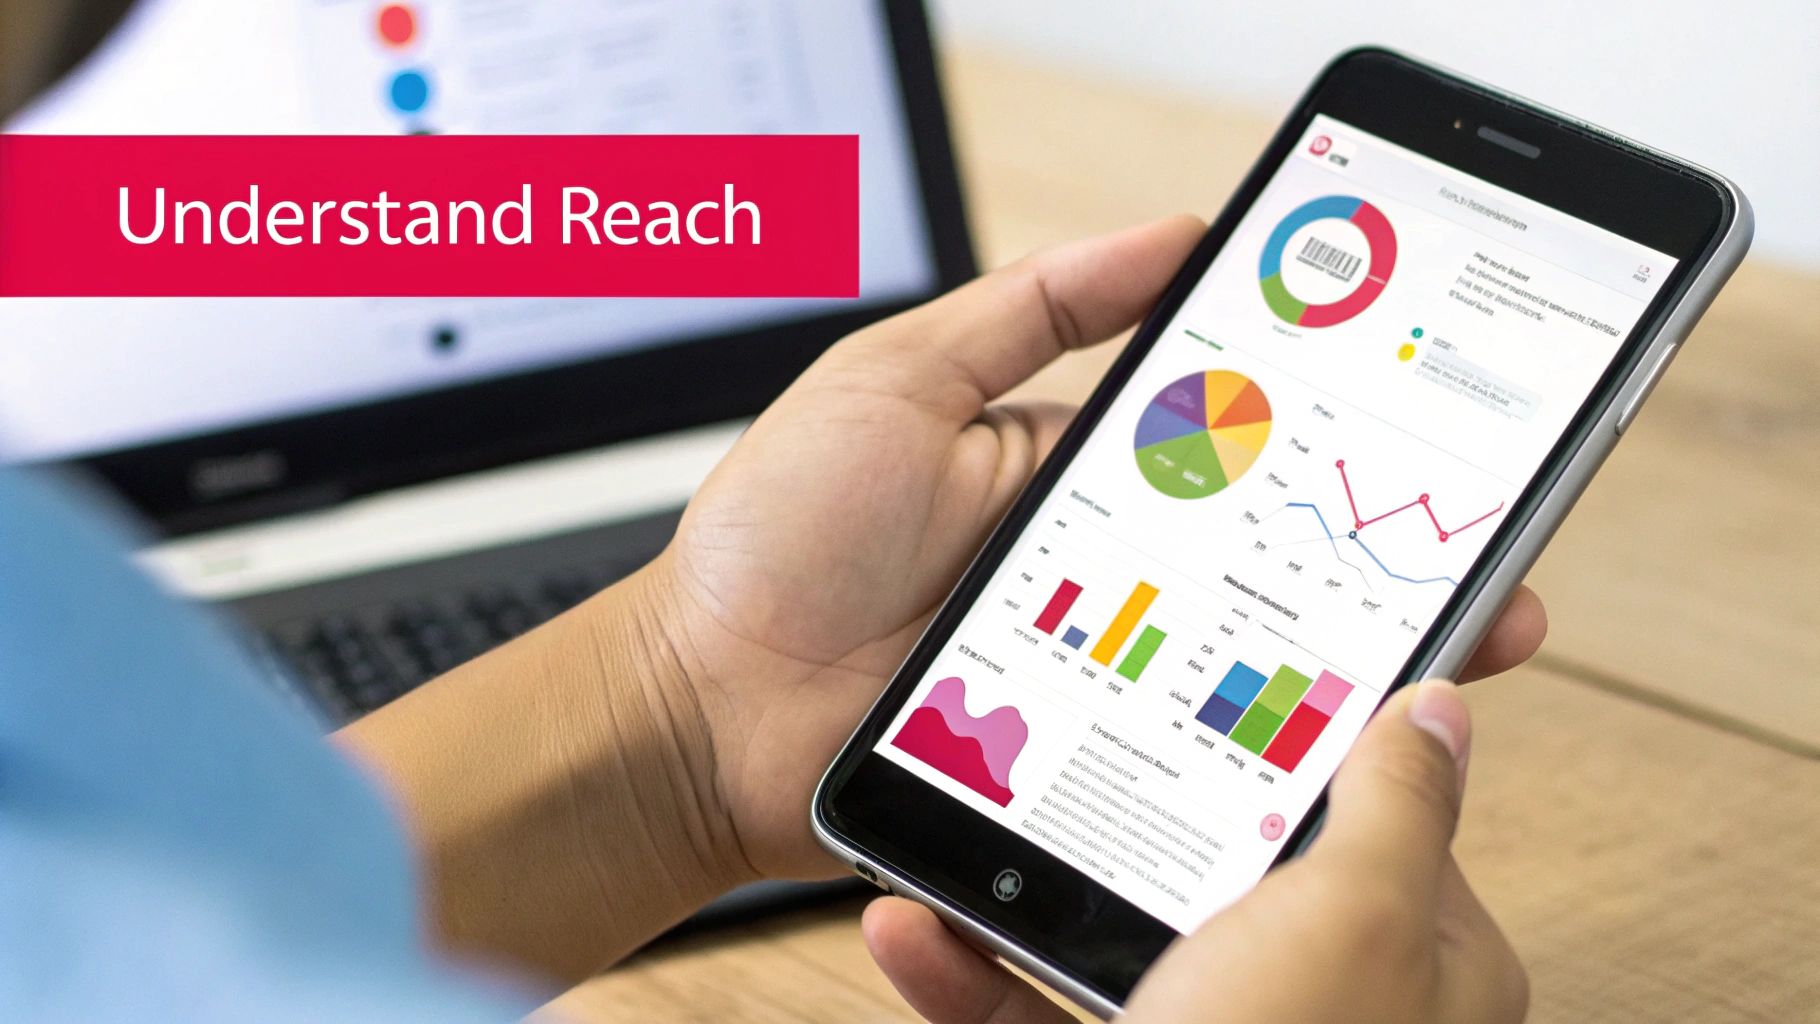
Before we can get into the nitty-gritty of how to calculate reach, we need to be on the same page about what this metric actually is. It’s a common mistake to see “reach” and think it’s just your total follower count. But that’s a simplification that can lead you down the wrong path with your strategy.
In simple terms, reach is the total number of unique individuals who see your content. It’s not about the potential audience you have; it’s about the actual number of people your message connected with.
Beyond Follower Counts
Having a huge follower count feels good, but it doesn’t automatically mean everyone sees your posts. Social media algorithms on platforms like Instagram and Facebook are the gatekeepers, deciding which content shows up in users’ feeds. This means only a slice of your followers might see what you post organically.
Think about it this way: your post about a new product gets shared by someone who doesn’t even follow you. Their entire network could see it. All those unique viewers are now part of your reach, even if they’ve never heard of your brand.
This is a critical distinction. At its core, calculating reach is about measuring the unique users who laid eyes on your content, regardless of whether they follow you. Social monitoring tools like Brand24 help quantify this by tracking keyword mentions across various platforms, giving you a much wider view of your content’s journey. You can find more details on how to measure social media reach effectively on their blog.
Why This Distinction Matters
Getting this right changes how you think about marketing. Instead of just chasing a higher follower number, your goal shifts to creating genuinely shareable content that can travel far beyond your immediate audience. This mindset is a cornerstone of a strong ecommerce content strategy, because it focuses on real audience growth, not just vanity metrics.
When you understand reach in the context of other content engagement metrics, you get a much sharper picture of your brand’s true awareness. Seeing how many unique people your message actually touched tells you how effective your campaigns are and sets you up for more meaningful growth.
The Essential Formula That Makes Reach Calculation Simple
Let’s cut through the noise and get straight to the math that matters. While knowing the raw number of people your content reached is useful, the reach rate gives you a much clearer, more actionable story about your performance. It answers the crucial question: “What percentage of my audience actually saw this?”
This visual breaks down how we get from a pile of raw views to a clean, unique reach number.
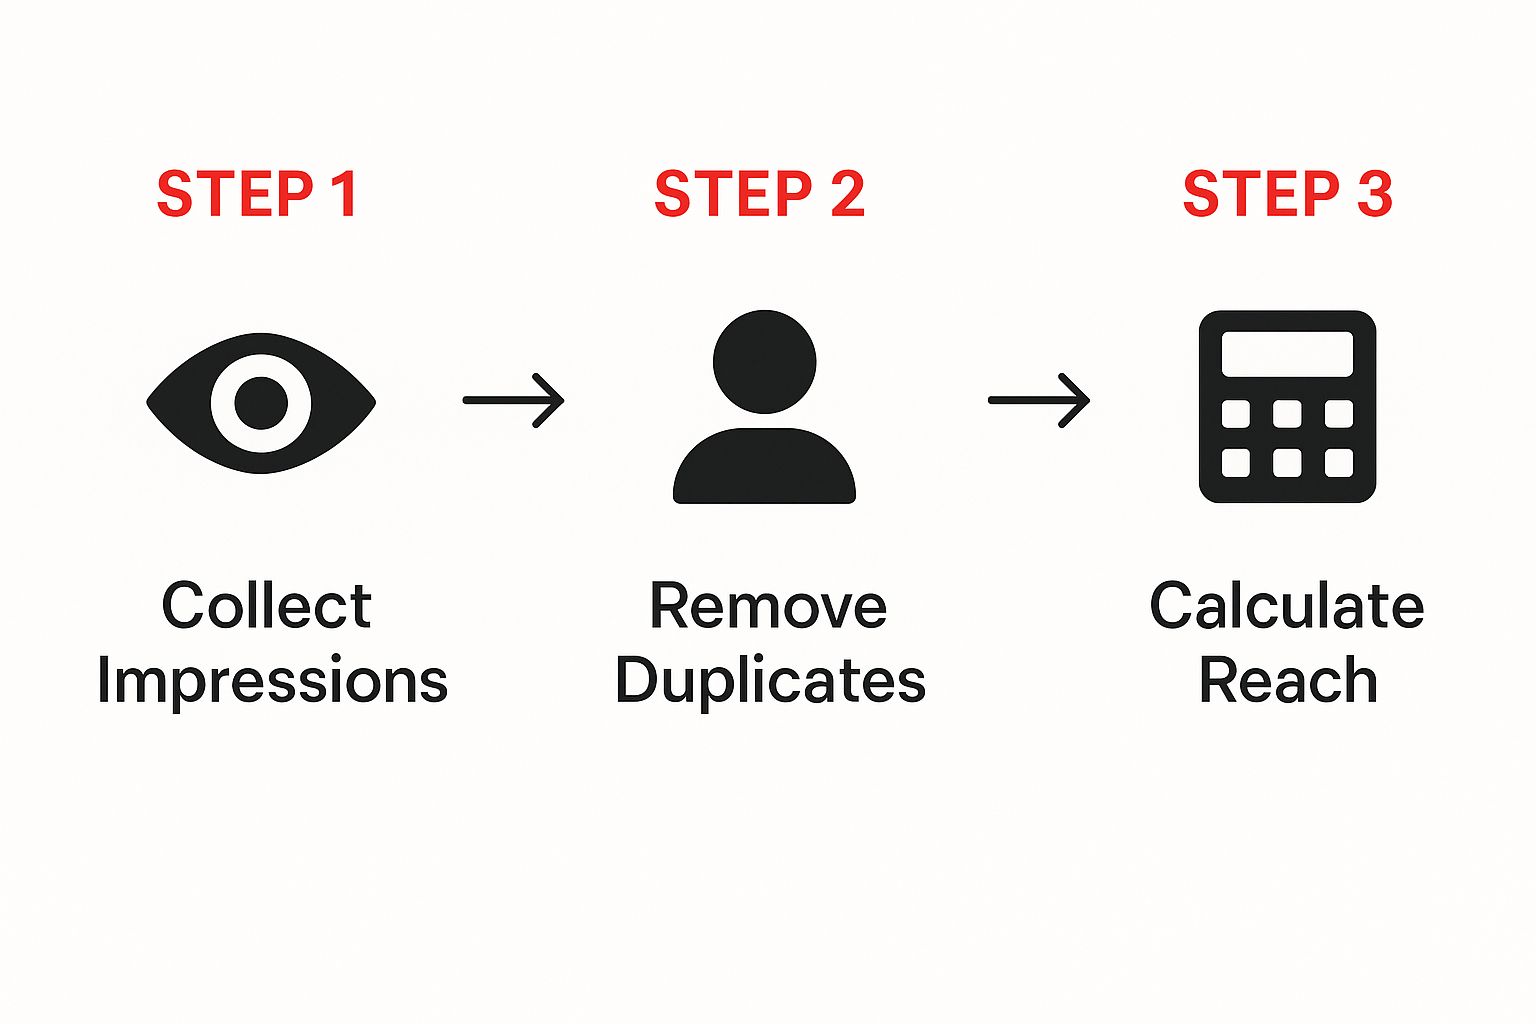
The main thing to remember is that reach counts unique individuals, not total views. This difference is fundamental to understanding how deeply you’re penetrating your target audience.
The Go-To Reach Rate Formula
So, how do you actually figure out your reach rate? The most common and effective formula is surprisingly straightforward:
Reach Rate = (Unique People Reached / Total Followers) x 100
This simple equation turns a basic count into a powerful percentage that tells a story. For instance, reaching 5,000 people might sound great on its own. But if your account has 100,000 followers, your reach rate is only 5%. Now, consider another brand with just 10,000 followers that also reaches 5,000 people. Their reach rate is an impressive 50%. Suddenly, it’s clear who is connecting with their audience more effectively.
This quantitative approach provides a solid benchmark. By dividing a post’s total reach by your follower count and multiplying by 100, you get a clear proportion of followers who saw your content. This gives you a much more nuanced view of performance than raw numbers ever could.
To give these numbers some real-world context, here are a few examples of how reach rates can look for different types of accounts.
Reach Rate Calculation Examples Across Different Scenarios
Real-world examples showing how reach rates vary across different account sizes and industries
| Scenario | Total Reach | Follower Count | Reach Rate | Performance Assessment |
|---|---|---|---|---|
| Food Blogger | 2,500 people | 10,000 followers | 25% | Strong. This rate is solid for a micro-influencer, indicating good content resonance with a dedicated audience. |
| Startup Tech Company | 8,000 people | 50,000 followers | 16% | Average. While not spectacular, this is a respectable rate for a B2B account, often facing more algorithmic challenges. |
| National Retail Brand | 75,000 people | 1,000,000 followers | 7.5% | Below Average. For a large brand, this signals that content isn’t cutting through the noise and may need a strategic refresh. |
| Local Restaurant | 1,200 people | 3,000 followers | 40% | Excellent. A high rate like this shows strong local community engagement and highly relevant content for its audience. |
As you can see from the table, a “good” reach rate isn’t one-size-fits-all; it’s highly dependent on your industry, audience size, and content strategy. A smaller, engaged community can often outperform a massive, passive one.
Using a percentage-based method helps you benchmark your performance over time, compare campaigns accurately, and justify your marketing spend. It shifts the conversation from “How many people saw this?” to “How well did we engage the audience we’ve built?” This shift is key to developing a smarter, more impactful social media strategy.
Navigating the Reach-Impressions-Frequency Triangle
Once you’re comfortable calculating reach, it’s time to bring two other critical metrics into the picture: impressions and frequency. Many marketers track these numbers separately, but they are actually three sides of the same triangle. Learning how they work together is what separates good campaign analysis from great.
Simply put, impressions are the total number of times your ad or content was shown, while reach counts the unique people who saw it. The metric that connects them is frequency—the average number of times each unique person was exposed to your content.
Using the Trio as a Diagnostic Tool
Think of these three metrics as a quick health check for your campaign’s performance. For instance, if you see sky-high impressions but your reach is disappointingly low, it means a small group of people is seeing your content again and again. This is a classic symptom of audience saturation.
In this scenario, your frequency number would be very high, signaling that you’re hammering the same audience instead of expanding your footprint. This is a clear cue to either broaden your targeting parameters or refresh your ad creative to fight off ad fatigue.
On the other hand, what if your reach number is nearly identical to your impressions number? This means your frequency is hovering right around 1. While you’ve successfully cast a wide net, you may have failed to make a lasting impact. It often takes several exposures for a message to truly stick and inspire someone to act.
Finding the Sweet Spot
There is no universal “magic number” for frequency; it all comes down to your specific campaign goals, your industry, and the complexity of your message. A key part of calculating social media reach is understanding this core relationship.
Remember this simple formula:
Frequency = Impressions ÷ Reach
Ultimately, your goal is to find the right balance between these three metrics. This ensures you’re running efficient campaigns that connect with the right audience just the right number of times, without wasting your budget or annoying your potential customers.
Finding Your Data Sources and Getting Accurate Numbers
Knowing the formulas is one thing, but your calculations are only as good as the data you feed them. Garbage in, garbage out, as they say. The most reliable starting point for finding your unique reach numbers is almost always the native analytics dashboard of the platform itself.
Trust, but Verify Your Data
Each platform, from Meta Business Suite to LinkedIn‘s built-in analytics, provides its own set of numbers. It’s a good practice to pull data directly from these sources, as they are the most accurate reflection of what the platform is tracking. Relying solely on third-party estimates can sometimes lead to discrepancies.
For example, here’s a look at the kind of data you might see in Meta’s analytics interface.
This dashboard clearly separates metrics like reach and impressions, which is essential for accurate calculations. When analyzing this, you’d focus on the “Reach” column to understand the unique number of people who saw your content during a specific period.
Using Tools to Aggregate and Compare
While native analytics are your source of truth, pulling data from multiple platforms can become a real headache. This is where dedicated analytics tools become so helpful. They connect to your social accounts and pull all the data into a single dashboard, saving you time and helping you spot cross-platform trends.
To efficiently gather accurate reach data across various platforms, it’s worth exploring the top social media analytics tools to find a solution that fits your needs. Many of these tools also provide benchmarking data, showing how your reach stacks up against industry averages—a key insight when you want to know if your performance is truly strong or just average.
Platform-Specific Calculation Strategies That Actually Work

Understanding the basic formula for reach is one thing, but the real test is applying it across different social media platforms. Each network has its own way of measuring things, and a strategy that crushes it on Instagram might fall flat on LinkedIn. If you ignore these platform-specific details, you risk misreading your data and making some off-base decisions.
For instance, what’s considered a good reach rate can vary wildly. On Instagram, hitting a 3.50% reach rate for a post is a solid performance, but Stories operate on a completely different set of benchmarks. Meanwhile, on Facebook, where organic reach can be notoriously low, even a 1.65% rate might feel like a major victory. Every platform defines and reports reach in its own unique way, which directly affects how you should calculate and interpret your performance.
Adapting to Different Content Formats
The type of content you post is just as important as the platform you post it on. An Instagram Reel, which is built for discovery, is going to be measured very differently from a standard feed post intended for your current followers. Likewise, a detailed professional article on LinkedIn has a completely different audience dynamic than a rapid-fire post on X (formerly Twitter).
Think about it this way:
- On Instagram & Facebook, always distinguish between “Accounts Reached” and “Impressions.” You should also break down your analysis by format—Stories, Reels, and feed posts—to see what’s actually capturing attention.
- On TikTok, the “For You Page” is a discovery powerhouse. Your reach can easily explode beyond your follower count, so tracking views from this source is essential for spotting viral potential.
- With LinkedIn, reach is deeply tied to your professional network and the engagement it generates. A single share from a well-connected person can give your numbers a massive and disproportionate boost.
To help you navigate these differences, here’s a breakdown of how major platforms handle reach calculations.
| Platform | Reach Definition | Calculation Method | Key Considerations | Best Practices |
|---|---|---|---|---|
| The number of unique accounts that have seen your post or story at least once. | Reported directly in Insights as “Accounts Reached.” | Differentiates between followers and non-followers; reach for Reels and Stories is often higher due to discovery features. | Analyze reach for Posts, Stories, and Reels separately. Track reach from hashtags and the Explore page. | |
| The number of unique people who saw any of your content. Can be organic, paid, or viral. | Provided in Page Insights; calculated for a specific time period (e.g., 28 days). | Organic reach for Pages is often low (~1-2%). Paid reach is more predictable. Viral reach tracks views from shares. | Focus on creating shareable content to boost viral reach. Use Facebook Ads to target specific demographics effectively. | |
| TikTok | The number of unique users who have watched your video. | Primarily measured by “Video Views” on the “For You Page” (FYP) and from followers. | The algorithm is key; content can go viral and reach millions regardless of follower count. | Use trending sounds and hashtags. Create content that encourages watches to completion and re-watches. |
| The number of unique members who have seen your update in their feed. | Shown as “Impressions” on individual posts, but represents unique viewers (similar to reach). | Reach is heavily influenced by engagement from 1st, 2nd, and 3rd-degree connections. Articles can have a longer lifespan. | Encourage comments and shares from employees and industry peers. Post content that adds professional value. | |
| X (Twitter) | The number of unique users who saw your Tweet. | Reported as “Impressions” in Tweet Analytics, which functions as the primary reach metric. | The fast-paced feed means content has a short lifespan. Retweets are the main driver of expanded reach. | Post consistently and engage in relevant conversations. Use relevant hashtags to appear in topic searches. |
As you can see, each platform tells a slightly different story with its data. Paying attention to these specifics will give you a much clearer picture of your performance than a one-size-fits-all approach ever could.
One powerful tactic to boost reach on any platform is to bring your community’s voice into your marketing. When you build a solid user-generated content strategy, you’re not just creating posts; you’re activating the networks of your most loyal customers. This creates a ripple effect, spreading your message in a way that feels authentic and trustworthy, which almost always leads to better engagement and a more meaningful impact.
Turning Your Reach Data Into Actionable Insights
Knowing how to calculate your reach is one thing, but the real value comes from turning those numbers into smart, strategic decisions that fuel your campaigns. This is the moment you stop just reporting metrics and start using them to get real results for your business.
Finding the Patterns in Your Performance
Think of your reach data as a collection of clues about your audience. Start looking for what stands out. Are certain kinds of content consistently hitting a wider audience? For instance, if you notice your educational carousels have a 30% higher reach than your product-focused posts, that’s your audience telling you exactly what they find valuable and worth sharing. This insight is gold for refining your content strategy.
Once you have your data, using a social media analytics dashboard can be a game-changer. These tools are great at visualizing trends that are easy to miss in a spreadsheet, helping you spot opportunities much faster.
Setting Benchmarks and Proving Your Value
Don’t let your reach data just sit there—put it to work by setting benchmarks. Look at your past performance and industry averages to set realistic goals. Maybe you decide to aim for a consistent 5% increase in monthly reach. Just like that, reach goes from a passive number to an active key performance indicator (KPI).
When you track your progress against these goals, you create a powerful story for stakeholders. Instead of just saying, “our posts were seen a lot,” you can show clear, strategic growth and build a solid case for your marketing budget. By connecting reach to bigger business objectives, you prove the real impact of your work. For a deeper dive into forecasting, you can learn more about applying predictive analytics for marketing.
Your Reach Calculation Action Plan
Now that we’ve walked through the formulas and data sources, it’s time to put it all into practice. This isn’t about some abstract theory; it’s about building a solid, repeatable system for tracking, analyzing, and actually improving your reach. Think of this as your game plan for turning simple reach calculations into real strategic wins.
Setting Up Your Reach Tracking System
First things first, you need a consistent routine for gathering your data. I’ve found that picking a regular interval—like weekly or bi-weekly—is the sweet spot for most brands. This consistency is the secret to spotting trends before they become problems.
- Go Straight to the Source: Always start with the native analytics from each platform, whether it’s Meta Business Suite, LinkedIn Analytics, or TikTok Analytics. This data is your ground truth.
- Create a Central Hub: Use a spreadsheet or a dedicated social media dashboard to bring all that data together. This gives you a single, clear view of your performance across every channel, saving you from bouncing between tabs.
- Log the Essentials: For each platform, you’ll want to record your Total Followers, Post-Level Reach, Post-Level Impressions, and Total Engagements. This core dataset will fuel all your calculations and deeper analysis.
Troubleshooting and Benchmarking Your Progress
Even with the best system, mistakes can happen. If your numbers ever look a bit off, the first place I always check is the classic reach vs. impressions mix-up. It’s a common slip-up, so double-check that you’re using the unique reach figure and not the total impression count.
Once you know your data is clean, it’s time to set benchmarks that actually matter to your brand. Industry averages are a decent starting point—for example, the average reach rate on Instagram hovers around ~3.50%. But your most important benchmark is your own history. Calculate your average reach rate over the last three months to create your baseline. From there, the goal is simple: beat your past self.
This structured approach changes how to calculate reach from a boring task into a powerful part of your strategy. By systemizing how you track and analyze your numbers, you’re not just looking at what happened; you’re building an engine for consistent growth.
Ready to pair this plan with content that truly connects with your audience? JoinBrands links you with a network of over 250,000 creators who specialize in producing authentic, high-impact content designed to grow your reach and deliver real results.