



 AI Creator Search: A Guide to Psychographic Targeting
The global influencer marketing industry is projected to reach $32.55 billion in 2025, up 35.6% year over year from $24 billion in 2024 according to Archive's influencer marketing projection statistics. That number matters for one reason. It means influencer marketing is no longer a side experiment you can judge by vibes, screenshots, and follower counts.
The old playbook was simple. Pick creators who look on-brand, ship product, watch likes roll in, then hope Shopify tells a good story later.
That playbook breaks fast once budgets get real.
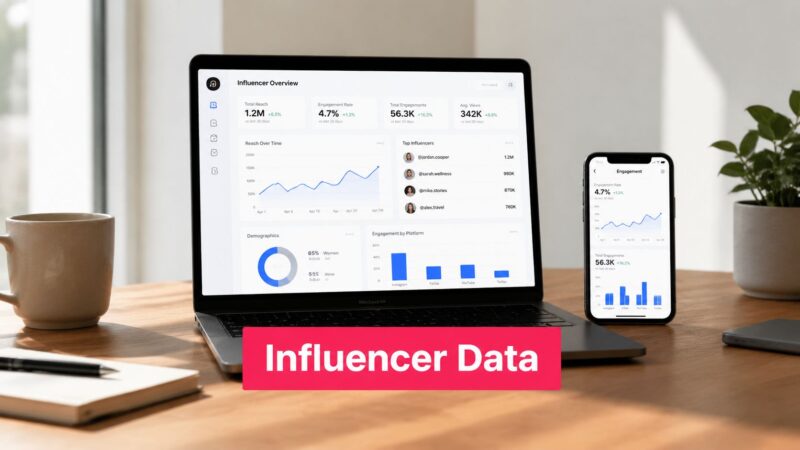
If you're running creator programs for a DTC brand, the hard part isn't finding content. It's building a system that tells you which creators drive awareness, which ones move shoppers closer to purchase, which assets deserve paid amplification, and which partnerships should end. That's what influencer marketing data is for. Not reporting for reporting's sake. Revenue decisions.
Table of Contents
The Data-Driven Shift in Influencer Marketing
A lot of teams still talk about influencer as if the main question is whether it works. That conversation is outdated. The real question is whether your team can measure it well enough to scale it without wasting spend.
Most brands don't fail because creators stop creating. They fail because their data lives in five places, nobody agrees on attribution, and campaign reviews still center on vanity metrics. A post can look strong in-feed and still produce weak business results. Another can look average on the surface and subtly become your highest-converting asset in retargeting.
That's why the market's growth matters. When a channel reaches projected spend of $32.55 billion in 2025 and grows 35.6% year over year per Archive's market outlook, operators have to treat it like paid media, not PR with discount codes.
What changed inside serious teams
The shift is practical, not philosophical:
- Budgets need proof: Finance doesn't care that a creator had a nice comment section. They care whether the program produced profitable customer action.
- Content has a second life: The post itself is only part of the value. Strong creator assets often perform again in ads, landing pages, email, and PDPs.
- Selection needs rigor: Picking creators by taste alone usually leads to mismatched audiences and soft conversion.
Practical rule: If your campaign summary starts with impressions and ends there, you don't have a measurement system. You have a highlight reel.
What good teams do differently
They build a data-to-revenue workflow. They define funnel goals before outreach. They track creator-level performance, content-level performance, and sales outcomes separately. They compare what looked good socially against what sold.
That's how influencer marketing becomes predictable. Not easy, but measurable. And once it's measurable, you can improve it.
What Is Influencer Marketing Data Really
Influencer marketing data is easiest to understand if you stop thinking about dashboards and start thinking about a car.
A driver doesn't need every mechanical detail at once. They need the instruments that keep the trip on course. Speed tells you pace. Fuel tells you whether you'll make it. GPS tells you whether you're even heading to the right place. Campaign data works the same way.
Some metrics tell you how fast a campaign is moving. Others tell you whether it's moving toward the right customer.

Performance data
This is the speedometer side of influencer marketing data. It tells you what happened after content went live.
Performance data usually includes metrics such as reach, impressions, clicks, conversions, sign-ups, sales, and return on investment. These numbers help answer execution questions. Did people see the content? Did they interact? Did they visit the site? Did they buy?
The mistake many teams make is stopping at the social layer. Likes and views can be useful, but only in context. A creator can generate strong attention and weak intent. Another may drive fewer visible interactions but send highly qualified traffic that converts.
Audience data
Audience data is your GPS. It tells you whether the campaign is reaching your intended audience.
This includes audience demographics, interests, geography, shopper fit, and behavioral alignment with the product. In practice, this matters more than is widely acknowledged. A creator who looks perfect aesthetically can still miss the business goal if their audience composition doesn't match the buyer.
The cleanest creator brief in the world won't fix bad audience fit.
A simpler way to sort noisy metrics
When teams get overwhelmed, I recommend sorting every metric into one of four buckets:
- Awareness: Who saw the message and how often.
- Engagement: Who cared enough to react, comment, save, share, or watch.
- Conversion: Who took a desired action.
- ROI: What value the campaign produced relative to cost.
Once you do that, the reporting gets clearer. You stop debating whether a metric is good in the abstract and start asking whether it is good for the stage of the funnel you're trying to improve.
That's the difference between collecting data and using influencer marketing data well.
Decoding Your Campaign Funnel with KPIs
A creator campaign doesn't succeed because one metric spikes. It succeeds when the right metrics move at the right stage of the funnel.
The fastest way to lose control of reporting is to judge all creators by the same KPI. Awareness creators shouldn't be judged like affiliate closers. Conversion creators shouldn't be picked only for aesthetics. Put each metric where it belongs.
A simple funnel view helps.

Top of funnel KPIs
At the top, you're measuring distribution and visibility. Reach, impressions, mentions, and content volume are the key metrics.
These metrics answer basic questions. Did the campaign get in front of enough people? Did multiple creators create repeated exposure? Did the brand show up in relevant conversations?
This is also where larger creator accounts can look attractive. But reach alone can mislead, especially if the audience isn't aligned or the views don't translate into any measurable next step.
Mid-funnel KPIs
The middle is where attention turns into intent. This is usually the most under-managed part of creator programs.
Here, I look at engagement quality, click behavior, site visits from creator traffic, and how specific content formats hold attention. For many DTC brands, this is also where you learn whether the creative angle is resonating before purchase.
One useful benchmark comes from Sprinklr's influencer statistics roundup. In 2025, micro-influencers with 10K to 100K followers average a 3.86% engagement rate on Instagram, compared with 1.21% for macro-influencers. That's a strong reminder that smaller creators often produce more responsive audiences, not just cheaper inventory.
Bottom-funnel KPIs
The channel earns its budget allocation by delivering sales, leads, sign-ups, cost per acquisition, and revenue attributed to specific creators or assets.
Direct response teams often over-focus here and ignore everything above it. That's also a mistake. Bottom-funnel results are shaped by creative quality, audience fit, landing page consistency, and how many warming touches happened before the purchase.
Operator note: A weak last-click report doesn't always mean the creator failed. It can mean your attribution model is too narrow.
A quick KPI reference
| Funnel Stage | KPI | What It Measures | Why It Matters |
|---|---|---|---|
| Top of Funnel | Reach | Unique people exposed to the content | Shows audience breadth |
| Top of Funnel | Impressions | Total times content was viewed | Helps gauge repeat exposure |
| Top of Funnel | Mentions | Brand references across creator content | Indicates visibility and share of conversation |
| Consideration | Engagement Rate | Audience interaction with the content | Signals resonance and content quality |
| Consideration | Click-Through Rate | Visits from creator content to site or landing page | Shows movement from interest to action |
| Consideration | Traffic | Sessions driven by the campaign | Connects social content to owned channels |
| Conversion | Sales | Purchases attributed to creators or assets | Ties activity to revenue |
| Conversion | Leads | Qualified inquiries or submissions | Useful for higher-consideration offers |
| Conversion | Sign-ups | Email or account creation events | Tracks lower-friction conversion goals |
| Conversion | CPA | Cost to acquire a customer or lead | Shows efficiency |
| Loyalty | Repeat Purchases | Follow-on buying behavior | Measures customer quality beyond first order |
| Loyalty | Brand Mentions | Ongoing organic conversation after campaign | Suggests sustained brand impact |
| Loyalty | Retention Rate | Continued customer relationship | Helps assess long-term value |
For teams that don't want to hand-stitch these signals together, creator platforms can reduce a lot of manual work. A creator marketplace profile like Alex Digital Mama on JoinBrands is one example of how brands can review creator fit and content style before a campaign ever launches.
Your Primary Influencer Data Sources
Most reporting problems don't come from a lack of data. They come from data fragmentation.
The same campaign can produce platform analytics, creator screenshots, affiliate clicks, Shopify orders, paid ad performance, and customer service feedback. None of that is useful until someone decides which source is the source of truth for each question.
Native platform analytics
Instagram Insights, TikTok Analytics, YouTube Studio, and marketplace dashboards give you the first layer of visibility. They show content delivery, audience interaction, watch patterns, and some audience composition.
These are good for top and mid-funnel signals. They're less dependable for full revenue reporting because they usually stop before the sale or only show part of the path.
Creator-submitted reports
Sometimes the only way to verify story views, taps, or post-level details is to ask creators for screenshots or exports.
This works, but it doesn't scale cleanly. Files arrive late, naming conventions are inconsistent, and screenshots don't merge well into structured reporting. They're fine as backup proof. They're weak as the backbone of an analytics workflow.
Tracking links and affiliate setups
UTM parameters, landing pages, discount codes, and affiliate links help bridge content performance to owned-channel behavior.
They aren't perfect. People don't always buy in the same session, and some customers will see creator content, leave, then return later through branded search or email. Still, these tools are essential if you want any reliable creator-level attribution.
First-party commerce data
Your ecommerce platform is where financial truth lives. Orders, refund behavior, average order value, new versus returning customer mix, and post-purchase behavior matter more than social applause.
When a campaign review ignores first-party sales data, the team usually ends up rewarding creators who entertain instead of creators who sell.
UGC and asset-level performance
Once creator content enters paid social, email, product pages, or retail media, the creator post is no longer the whole unit of analysis. Now you're measuring the asset itself.
A mediocre organic post can become a strong paid ad. A beautiful video can underperform on a PDP because the first three seconds don't show the product clearly. That's why content-level analysis matters separately from creator-level analysis.
If you only remember one thing here, remember this. Raw influencer marketing data is scattered by default. The primary task is unifying it without losing context.
A Simple Workflow for Data Collection and Analysis
Teams overcomplicate this. You don't need a giant measurement architecture to start using influencer marketing data well. You need a repeatable workflow that the whole team follows every time.

Collect and aggregate
Start by deciding what will be pulled automatically and what will be logged manually. At minimum, keep one record for each creator, one record for each content asset, and one record for each tracked outcome.
A practical setup usually includes:
- Creator sheet: Handle, platform, audience fit notes, campaign brief, deliverables.
- Content sheet: Post URL, format, hook angle, publish date, asset status, usage rights.
- Performance sheet: Reach, engagement, clicks, conversions, revenue, code usage.
- Cost sheet: Product cost, creator fee, paid amplification spend, shipping, discounts.
If you're building internal process maturity, this guide for AI-driven marketing teams is a useful companion for structuring broader marketing analysis habits beyond creator campaigns.
Clean and standardize
This step is boring, which is why teams skip it. Then they wonder why every report becomes an argument.
Standardize creator names, date formats, campaign naming, metric definitions, and attribution windows. Decide whether "conversion" means purchase only or includes sign-ups. Decide whether you report gross revenue or net revenue. Decide how you'll tag whitelisted or Spark-style content versus organic-only content.
Messy data doesn't just slow reporting. It changes the answer.
A creator listed three different ways across spreadsheets can split performance history and make a repeat partner look average. One missing UTM convention can wipe out your ability to compare content angles.
Analyze and visualize
Only after the data is clean should you start looking for patterns.
I usually want answers to five questions:
- Which creators drove the strongest qualified traffic
- Which assets held attention long enough to merit paid reuse
- Which audience segments responded best
- Which offers converted without margin damage
- Which partnerships should move to an always-on test pool
This is where software starts earning its keep. Tools that unify creator discovery, workflow, asset management, and performance tracking remove a lot of spreadsheet maintenance. For example, Allar Collabs on JoinBrands sits inside a platform environment where brands can manage briefs, review creator output, and keep campaign operations tied to measurable outcomes rather than scattered approvals.
A practical reporting rhythm
Don't wait until the campaign ends.
Use a simple cadence:
- Early read: Check delivery, publishing compliance, and initial engagement.
- Mid-campaign read: Compare clicks, landing page behavior, and asset quality.
- Post-campaign review: Evaluate attributed revenue, assisted impact, and reusable content value.
That cadence keeps you from making the classic mistake of discovering bad creator fit after all the product is gone and the budget is spent.
Putting Data into Practice with Real Campaign Examples
A hypothetical skincare launch is a good way to show how this works in practice.
Say a DTC brand is launching a new serum. The product is aimed at shoppers who care about texture, routine simplicity, and visible daily use. The team doesn't need the loudest creators. It needs creators whose audience already buys skincare with intent.

Creator selection before content goes live
The first pass isn't about follower count. It's about audience match, content style, and whether the creator can demonstrate the product in a believable routine.
A smart operator would shortlist creators whose audience composition aligns with the buyer. That matters because this LinkedIn analysis of influencer metrics notes that the closer the demographic match between the influencer's audience and the brand's target customer, the higher the conversion rate. It also notes that creators who post stories 3 to 5 times per day outperform those posting once every few days by significantly increasing attention and conversion rates.
So the brand builds the brief around behavior, not just format:
- Routine demonstration: Show where the serum fits in a daily regimen.
- Story follow-through: Use multiple story touches across the day instead of a single mention.
- Clear handoff: Push to a product page or offer with a creator-specific code.
Mid-funnel reading during launch week
Once content is live, the team should separate what is visually appealing from what is moving shoppers forward.
One creator might produce gorgeous content with high comment volume but low site traffic. Another might have less obvious social heat yet send highly qualified visitors who stay on page, browse ingredients, and add to cart. That's why the report should compare engagement, clicks, and onsite behavior side by side.
A creator like Abby Does UGC on JoinBrands represents the type of profile brands often evaluate for this kind of campaign. The useful question isn't whether the content looks polished. It's whether the creator's style, audience, and deliverable mix line up with the campaign's commercial goal.
A creator isn't "good" in the abstract. A creator is a fit or not a fit for a specific offer, audience, and funnel stage.
Revenue attribution after the campaign
At the end of the launch, the team shouldn't look only at direct code redemptions. It should review which creators drove first purchases, which content was reused in paid channels, and which assets deserve another test with a different hook or landing page.
That's where influencer marketing data stops being a recap document and becomes an operating system. You don't just ask what happened. You decide what to repeat.
Navigating Attribution Privacy and Measurement Gaps
Attribution is where clean campaign narratives go to die.
A customer sees a Reel on Tuesday, gets retargeted on Thursday, clicks an email on Friday, and buys through branded search on Saturday. Which touchpoint gets credit? If your answer is "the last one," you're probably undercounting influencer impact. If your answer is "all of them equally," you're probably overstating it.
The attribution model problem
First-touch models overreward discovery. Last-touch models overreward closers. Multi-touch models are directionally better, but they depend on data quality that many teams lack.
That doesn't mean measurement is impossible. It means you need to treat attribution as a decision framework, not a courtroom verdict. For DTC brands, I usually recommend looking at three layers together:
- Direct attribution: Codes, affiliate links, creator landing pages
- Assisted signals: Branded search lift, view-through behavior, returning visitor paths
- Asset value: Whether the content performs in paid, email, or onsite placements
Privacy made this harder
Privacy changes reduced the amount of user-level tracking marketers used to rely on. That pushed more teams toward modeled reporting, first-party data, and blended interpretation.
The mistake is pretending you can still see every step of the journey with perfect confidence. You can't. What you can do is tighten your instrumentation, keep your naming clean, and compare creators on the same measurement rules.
The mega-influencer blind spot
There's also a gap the industry doesn't talk about enough. As Bright Brittany's LinkedIn post on measurement gaps puts it, a major question is how to accurately measure paid reach and conversion for mega-influencers when free data is unavailable. That lack of transparent paid-performance data makes it harder for brands to optimize full-funnel programs that include top-tier creators.
This is one reason mega-influencer deals can become storytelling exercises instead of performance programs. The audience size looks powerful. The business evidence is often incomplete.
Treat large-creator campaigns like mixed-media buys. Demand clearer tracking plans before launch, not after reporting disappoints.
The practical answer isn't to avoid bigger creators entirely. It's to be honest about what you can and can't measure, then structure the brief, offer, and downstream tracking accordingly.
Conclusion Turning Data into Predictable Growth
Influencer marketing isn't a mystery channel anymore. It's an operational channel. The brands that win are the ones that stop confusing activity with performance.
Good teams collect the right inputs, standardize their measurement, compare creators by funnel role, and connect campaign output to commerce data. They don't obsess over vanity metrics. They use influencer marketing data to decide who to hire again, which assets to amplify, and where the next dollar should go.
That discipline matters because the returns can justify it. Brands investing in influencer marketing typically see about $5.20 to $5.78 for every dollar spent, and 80% of brands maintained or increased their budgets in 2025, according to Factory PR's overview of the influencer marketing industry.
That's the key takeaway. Creator marketing becomes far more useful when you stop treating it like a black box. Build a system. Track what matters. Keep revenue at the center.
If you want a simpler way to run creator programs without juggling spreadsheets, screenshots, DMs, and separate reporting layers, JoinBrands gives brands one place to manage creator sourcing, briefs, content approvals, and performance tracking with a workflow built for measurable outcomes.