





 Your Instagram Reels Marketing Strategy for 2026
You pull last week's dashboard, see an Instagram engagement rate of 1.8%, and freeze for a second. Is that strong? Is it weak? Should you brief more creators, change formats, or leave the campaign alone?
Teams make the wrong move here. They compare that number to a random “good engagement rate” they found in a generic benchmark post, then overcorrect. That's how solid campaigns get killed and weak campaigns get protected.
Engagement benchmarks only matter in context. If you benchmark a Reels-heavy beauty brand the same way you benchmark a LinkedIn carousel publisher, you're not measuring performance. You're mixing incompatible systems and calling it insight.
Table of Contents
Why a Single Engagement Benchmark Never Tells the Whole Story
You review a weekly report and see one number circled in red: 1.8% engagement on Instagram. If you treat that number as a verdict by itself, you will make bad budget decisions.
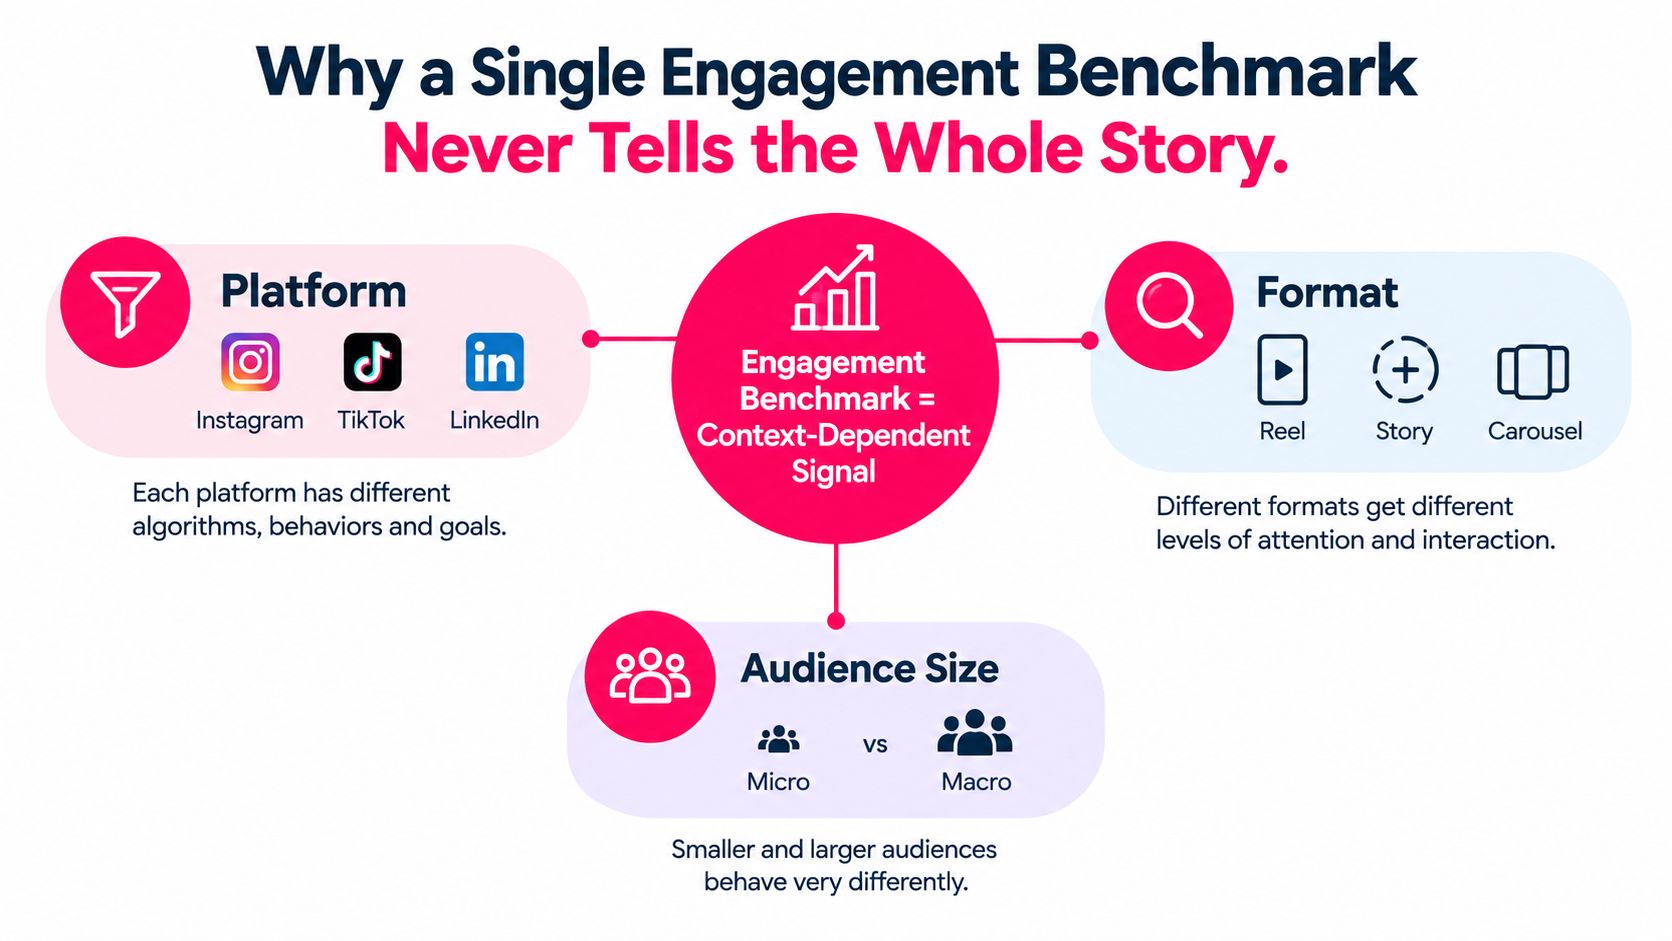
A single benchmark flattens variables that drive performance. Platform matters. Format matters. Audience tier matters. Funnel position matters. A creator prospecting on TikTok, a product explainer on YouTube, an Amazon post-purchase asset, and a promotional email are not competing inside the same engagement system.
Platform averages obscure the underlying story
Platform-wide averages are useful for orientation, not judgment. Analysts at Emplifi found that median engagement rates shifted sharply by quarter and by platform, with TikTok far above Facebook and Instagram moving materially over time. That should end the habit of asking for one universal "good engagement rate."
The problem gets worse once you compare datasets. One benchmark report can show platform medians that look aggressive because it includes creator-heavy or video-heavy content. Another can show lower medians because it reflects large brand accounts publishing at scale across mixed formats. Both can be correct. They are measuring different populations.
That is why generic averages mislead campaign teams. They hide the performance drivers you control: creative format, account size, distribution model, and campaign goal.
Judge every benchmark through three filters
If you need a number you can defend in a brief, use these filters first:
- Channel filter: TikTok, Instagram, YouTube, Amazon, and email produce engagement in different ways. A strong email click rate does not map to a strong Instagram engagement rate, and neither should be judged against a social average.
- Format filter: Short-form video, Stories, static posts, long-form YouTube, Amazon review content, and email promos attract different interaction patterns. Format is often a bigger driver than platform.
- Tier and funnel filter: Smaller creators usually post higher engagement rates because the denominator is smaller. Top-of-funnel assets can generate heavy interaction and weak sales efficiency. Bottom-of-funnel assets often do the opposite.
Practical rule: Do not label any engagement rate good or bad until you know the platform, format, denominator, account tier, and funnel role.
Teams that ignore those filters usually misread creator performance. They cut creators with healthy conversion-focused content because the engagement rate looks quiet, and they overpay for noisy top-of-funnel content that will never close revenue. The fix is simple. Stop using one average as a decision tool. Compare each asset against the right peer set.
Defining Engagement Benchmarks and the Formulas Behind Them
An engagement benchmark is a reference point built from historical performance of comparable posts, accounts, or campaigns. The problem isn't the benchmark itself. The problem is using the wrong formula.
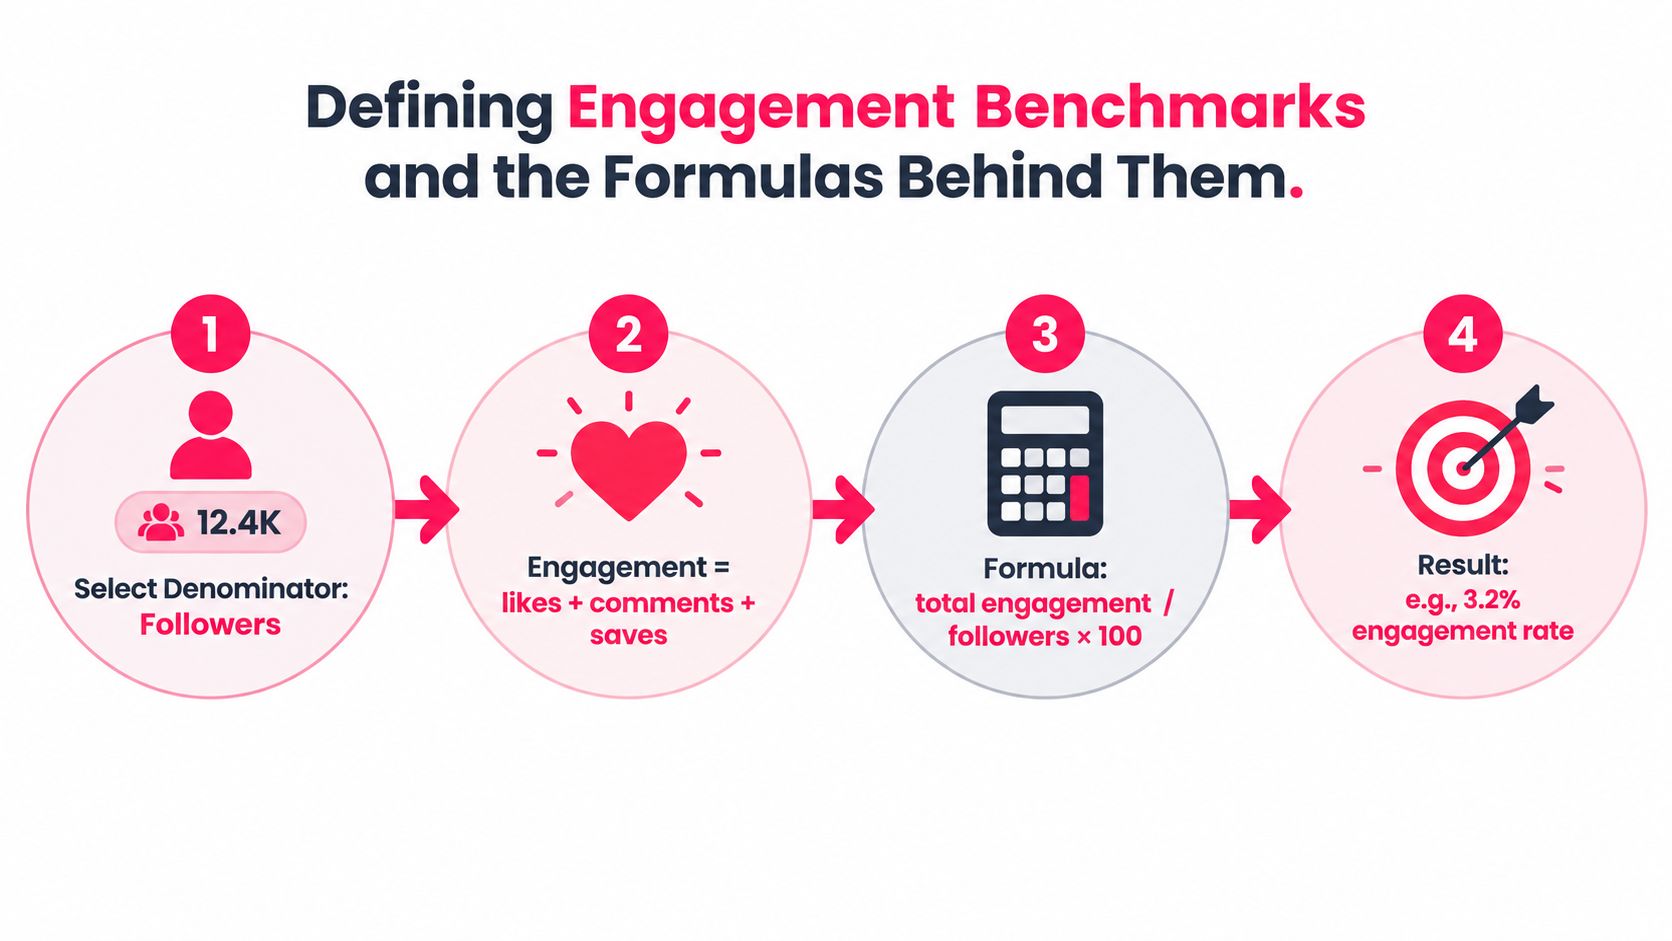
The most common social formula is follower-based engagement rate: likes + comments + shares divided by followers, multiplied by 100. Buffer uses that standard formula in its benchmark explanation and gives a simple example where 300 interactions from 10,000 followers = 3.0% engagement, as shown in Buffer's social media benchmarks guide.
The denominator changes the meaning
Use different denominators for different questions:
- Followers: Best when you want a stable post-to-post baseline across a creator or brand account.
- Reach: Better when distribution is uneven and you care about engagement from people who saw the content.
- Views: Better for short-form video because video distribution can extend far beyond followers.
- Impressions: Useful for paid media and repeated exposure analysis.
If your team mixes formulas inside the same report, the report is unreliable.
A worked example you can reuse
Say a creator has 50,000 followers. One Reel gets 3,200 likes, 180 comments, and 90 shares. Total engagements = 3,470.
Follower-based engagement rate:
- 3,470 / 50,000 × 100 = 6.94%
Now say that same Reel gets 180,000 views.
View-based engagement rate:
- 3,470 / 180,000 × 100 = 1.93%
Same post. Two different rates. Two valid interpretations.
The follower-based number tells you how strong the post was relative to the creator's audience base. The view-based number tells you how many viewers interacted after watching. For TikTok, Reels, and Shorts, use view-based engagement for creative diagnosis and follower-based engagement for creator comparison.
Here's a quick way to decide:
- Use follower-based ER when selecting creators.
- Use view-based ER when evaluating short-form hooks and creative packaging.
- Use reach-based ER for Stories and content with uneven delivery.
- Use impressions-based ER for paid amplification and whitelisting analysis.
A short explainer is worth watching if your team still calculates this inconsistently.
If you benchmark video with a follower denominator only, you'll underrate viral content and overrate under-distributed content.
Platform Benchmark Ranges for TikTok, Instagram, YouTube, Amazon, and Email
The fastest way to get benchmarking wrong is to force every channel into one table. Still, teams need operating ranges. The right approach is to keep the table narrow, practical, and honest about where hard benchmark data exists.
TikTok and Instagram have the clearest social benchmarks in the current data. Email has mature benchmarks with much tighter standardization. YouTube and Amazon require a more qualitative framework here because precise benchmark ranges for those channels weren't provided in the verified data.
What the benchmark data actually supports
One benchmark report showed TikTok at a 2.01% median engagement rate across industries and another at a 2.60% average engagement by followers, while Instagram sat much lower at 0.30% and 0.48% respectively, according to Quid's 2026 social media benchmark report. Another benchmark summary framed “good” thresholds as above 1.0% on Instagram, above 4.0% or 5.0% on TikTok, and above 0.20% to 0.25% on Facebook, based on platform-specific engagement benchmarks.
For format-specific performance, another 2026 benchmark source found Reels at 2.7%, versus 1.4% for carousels and 1.3% for static images, while also noting TikTok as the strongest major social platform for engagement in that reporting, according to Dash Social social media benchmarks.
Email behaves differently because the metrics are older and more standardized. Updated 2024 benchmark reporting listed an average email open rate of 39.64%, average click-through rate of 3.25%, average click-to-open rate of 8.62%, average unsubscribe rate of 0.15%, spam complaint rate below 0.01%, and average bounce rate of 2.33%, according to GetResponse email marketing benchmarks.
Platform engagement benchmarks by metric type 2026
| Platform | Average | Good | Strong | Primary Denominator |
|---|---|---|---|---|
| TikTok | 2.01% to 3.70% | Above 4.0% | Above 5.0% | Views for creative analysis, followers for creator comparison |
| 0.30% to 0.48% | Above 1.0% | Qualitatively, clearly above account baseline | Followers or reach | |
| YouTube | No verified percentage benchmark provided | Benchmark against your own format and audience baseline | Strong performance should be judged with retention, comments, and click intent, not one universal ER | Views |
| Amazon | No verified percentage benchmark provided | Use listing-level and post-purchase comparisons, not a universal engagement target | Strong performance should be tied to review velocity, content interaction, and conversion contribution | Listing traffic or post-purchase action |
| 39.64% open rate, 3.25% CTR, 8.62% CTOR | Above your list baseline with stable unsubscribes | High-quality lists can materially outperform the average in benchmark studies | Delivered emails |
Most universal averages mislead. A TikTok at 3% is already above the overall median in one benchmark set. An Instagram Reel at 1.2% is above the “good” threshold in another benchmark set. Those two assets can both be strong, even though the raw percentages look far apart.
If you manage Amazon and email alongside social, don't force them into vanity-style engagement thinking. Email opens and clicks are useful because they connect more directly to list quality, deliverability, and offer fit. Amazon content performance matters when it supports review generation, listing confidence, and purchase behavior. The benchmark should follow the business model, not the other way around.
How Follower Tier and Industry Segment Shift Engagement Rates
Follower count distorts benchmarking more than many teams admit. A brand compares a macro creator's engagement rate to a micro creator's rate, then concludes the larger creator underperformed. That comparison is usually wrong from the start.
A 2026 creator benchmark report found micro-creators under 10K followers typically reach 3.5% to 12% engagement, while creators with 100K+ followers average only 0.5% to 2%, according to InfluenceFlow's creator engagement benchmarks by niche and tier. That denominator effect is real. Bigger audiences widen reach, but they usually lower per-follower interaction rates.
Tier beats platform average
Here's the practical takeaway. If you're evaluating creators, tier-segmented benchmarks are more useful than platform-wide averages.
| Platform | Nano/Micro (1K-100K) | Mid/Macro (100K-1M) | Mega (1M+) | Industry Variation |
|---|---|---|---|---|
| TikTok | Higher engagement is common relative to larger tiers | Engagement usually compresses as follower count grows | Lowest relative ER is common | Performance varies sharply by niche and format |
| Smaller accounts often sustain tighter community response | Broader reach usually lowers follower-based ER | Large scale often trades ER for awareness | Reels-heavy consumer categories behave differently from static brand accounts |
Industry changes how you should interpret low engagement
The second trap is vertical bias. Beauty, food, and trend-led consumer categories often generate more visible interaction. Tech, finance, and B2B often look quieter but can carry stronger intent. Low visible engagement doesn't automatically mean weak commercial value.
Recent benchmark analysis also showed that recent multi-platform reporting can produce very different account-level averages from format-level medians. Buffer's 2026 analysis highlighted Instagram brand averages around 0.30% to 0.48%, TikTok around 2.01% to 3.70%, and LinkedIn company pages around 0.35% to 0.50%, while specific formats could run much hotter, including LinkedIn carousels at 21.77% and Facebook Live posts delivering 4x more engagement than link posts and 6x more than image posts, according to Buffer's state of social media engagement 2026.
Bigger creators usually buy you scale. Smaller creators usually buy you interaction density. Don't pay for one and score it like the other.
When reviewing a creator slate, look less at the raw engagement number and more at whether the creator beats the expected range for their tier, platform, and format. That's the fair comparison. Anything else leads to noisy creator selection and messy postmortems.
Setting Realistic KPIs and Evaluating Creators With Benchmark Data
Good KPI setting is simple. Pick the right denominator, compare creators against the right tier, and stop treating engagement as the only outcome that matters.
If you use one benchmark across all creators, your scorecard will favor small accounts by default. If you ignore downstream action, you'll renew creators who spark comments but don't move product.
Build KPIs around the channel first
Use a rolling view instead of a single-post snapshot. Use a 30-day trend for optimization and a 90-day trend for renewal decisions. That smooths out one-off spikes without making the reporting stale.
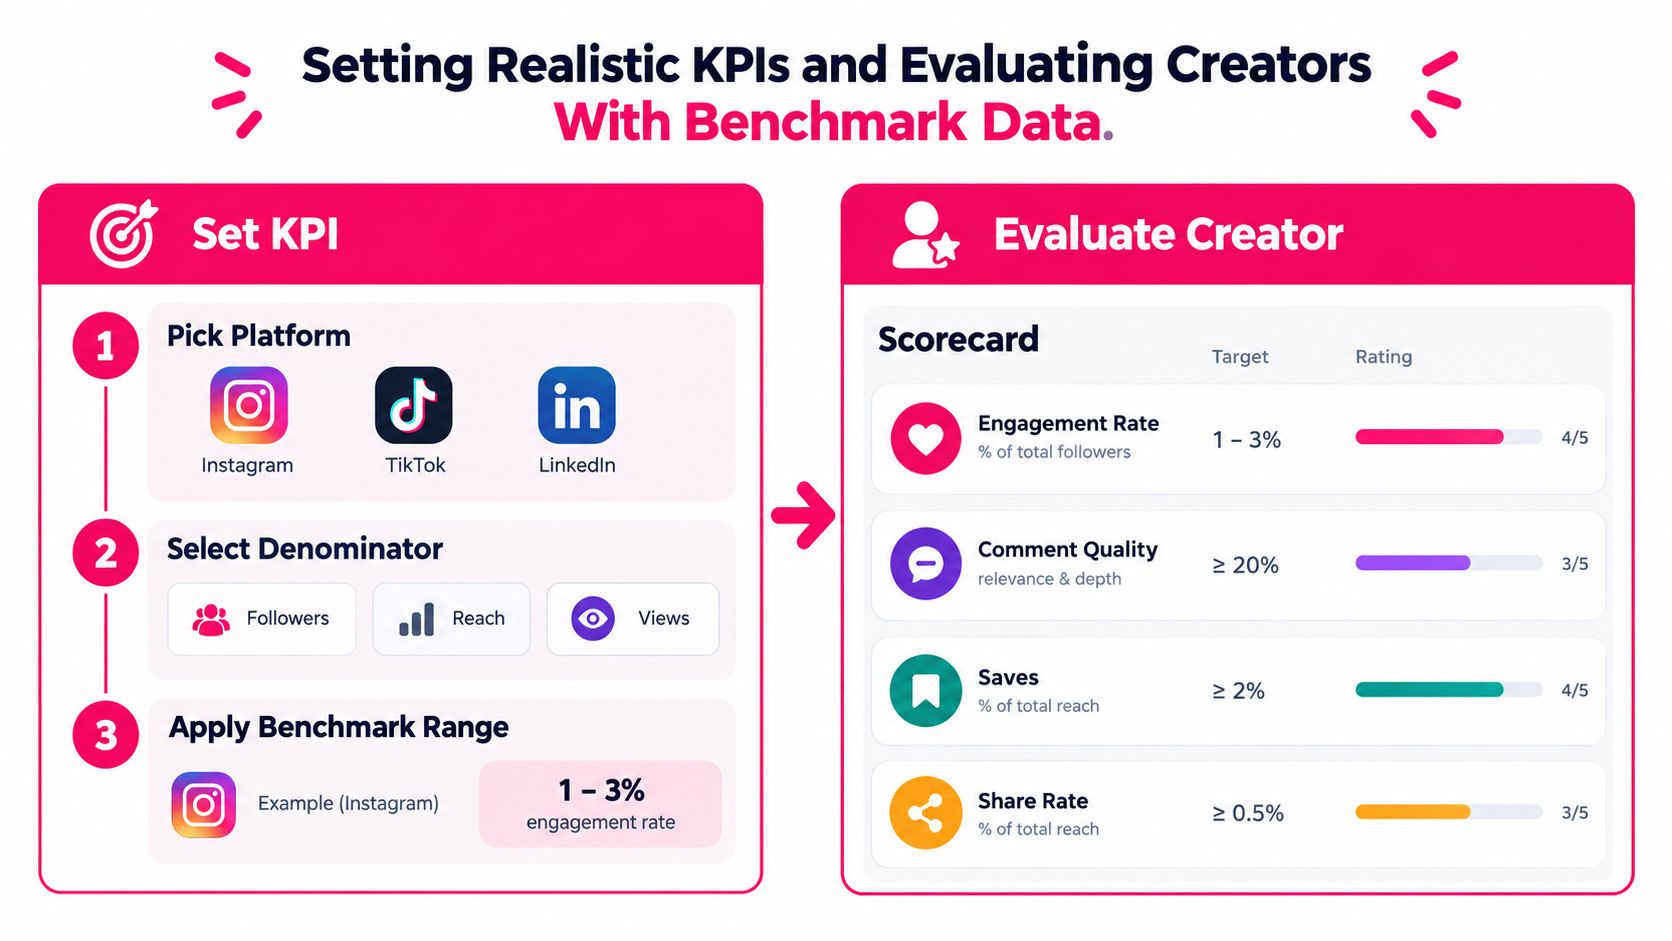
Then align denominator to channel:
- TikTok and Shorts: Prioritize view-based engagement for creative performance.
- Instagram feed and Reels: Use follower-based or reach-based engagement depending on distribution consistency.
- Stories: Use reach-based interaction rates.
- Email: Judge opens, clicks, click-to-open rate, unsubscribes, and bounce rate together.
Score creators with tier-aware targets
Set creator targets by follower tier, not just by platform. If your roster includes nano, micro, and macro creators, each needs its own expected range. A larger account should not need to match a small account's interaction density to be considered effective.
A weighted scorecard should include:
Engagement quality
Look beyond likes. Read comments, check saves, and inspect share behavior.Audience fit
The right niche matters more than broad reach when you need efficient conversion.Conversion contribution
Give credit for clicks, assisted purchases, and post-view lift where you can track it.
A creator platform can help operationalize this. JoinBrands gives brands a workflow for creator matching by niche and tier, campaign tracking for posted Instagram and TikTok content, and Spark Ads activation inside the same process, which makes it easier to keep benchmark logic tied to execution instead of scattered across spreadsheets.
Operational advice: A creator who lands slightly under a tier engagement target but drives stronger click intent can still beat a creator with a prettier ER and weaker buyer response.
You can normalize creator performance with a simple benchmark ratio:
- Creator ER / Tier Benchmark ER = Relative Performance Index
If the result is above 1, the creator is beating the benchmark for that peer group. That's easier for stakeholders to understand than arguing over raw platform averages.
Tactics to Improve Engagement and How a Creator Platform Helps
Most engagement problems aren't benchmark problems. They're packaging problems.
Teams blame the algorithm when the issue is weak hooks, generic formatting, lazy creator selection, or content that asks for attention before it earns it. If you want higher engagement, fix the asset before you blame the benchmark.
Tactics by channel that actually change outcomes
For TikTok, the first frame does most of the work. Open with the product, the result, or the tension. Native-feeling delivery matters more than polished brand editing. Short-form motion content tends to outperform static formats, and benchmark reporting has repeatedly shown stronger engagement on TikTok than on Instagram or Facebook in broad social comparisons, as noted earlier.
For Instagram, separate your goals by format. Reels are your distribution engine. Carousels often work better for saves and education. Stories work when the audience already knows you and has a reason to tap through. If a brand posts static product shots and then complains about weak engagement, the issue usually isn't the audience.
For YouTube, package for intent. Shorts need immediate payoff. Long-form needs a cleaner promise and stronger retention structure. Use pinned comments and community prompts to convert passive viewers into active responders.
For Amazon, treat engagement support as part of conversion support. Product content, creator-led demos, and post-purchase flows should reduce buying hesitation. A flashy social asset that doesn't help the listing sell is just creative decoration.
For email, don't chase opens only. Strong email performance depends on list quality, segmentation, deliverability, and whether the click path matches the promise in the subject line. Benchmark studies show opens can vary widely by list quality and brand mix, which is exactly why engagement benchmarks in owned channels need tighter audience control than most social reports.
A practical workflow for teams managing multiple surfaces
Use a simple operating rhythm:
- Creative testing: Rotate hooks, creators, and offers before changing budget.
- Format discipline: Match the format to the job. Reels for reach, carousels for saves, email for owned conversion.
- UGC repurposing: Take top creator assets and adapt them across paid, PDP, email, and social.
- Amplification: Put paid support behind the posts that already prove they can hold attention organically.
The point of a creator platform isn't just creator discovery. It's compression. Instead of spending days on outreach, asset collection, approvals, and handoff chaos, teams can keep creator matching, content review, performance tracking, and ad activation in one operating lane. That matters because benchmark discipline usually breaks when workflow gets messy.
Sample Reporting Template and Final Checklist for 2026
Most reports fail because they mix metrics from different systems and hide the denominator. Keep the reporting narrow, repeatable, and tied to action.
Here's a weekly template that works for creator programs, affiliate content, and hybrid paid-organic reporting.
Weekly Creator Engagement Report Template
| Creator | Platform | Tier | ER Formula | ER % | vs Tier Benchmark | CTR | Revenue / 1K Eng. |
|---|---|---|---|---|---|---|---|
| Creator A | TikTok | Micro | Views-based | [enter] | [enter] | [enter] | [enter] |
| Creator B | Macro | Followers-based | [enter] | [enter] | [enter] | [enter] | |
| Creator C | YouTube | Mid | Views-based | [enter] | [enter] | [enter] | [enter] |
| Creator D | Amazon | Brand partner | Channel-specific | [enter] | [enter] | [enter] | [enter] |
| Creator E | Owned audience | Delivered-based | [enter] | [enter] | [enter] | [enter] |
Final checklist before you present performance
Use this every week:
- Verify denominator consistency: Don't compare follower-based ER to view-based ER without labeling the difference.
- Clean the inputs: Exclude deleted posts, duplicate reporting pulls, and paid-only view inflation if your benchmark is meant to reflect organic performance.
- Flag underperformance early: Review creators who sit clearly below their tier benchmark, then inspect comments, clicks, and audience fit before making the cut.
- Pair engagement with business signals: Track CTR, assisted conversion, and revenue contribution next to ER.
- Re-baseline regularly: Platform behavior shifts. A benchmark table that worked last quarter can age fast.
The contrarian reminder matters most here. A high engagement rate means very little if add-to-cart behavior stalls. The reverse is also true. Some assets won't look flashy in a social dashboard but will still do the job because they drive qualified traffic, stronger PDP confidence, or cleaner conversion paths.
That's how you should use engagement benchmarks in 2026. As a decision tool, not a vanity score.
If you're running creator campaigns across TikTok, Instagram, Amazon, and UGC workflows, JoinBrands can help you match creators by niche and tier, track engagement signals inside the campaign workflow, and move top organic assets into Spark Ads faster. If your team is tired of benchmarking from scattered screenshots and spreadsheets, it's worth looking at a system that keeps creator selection, content ops, and performance review in one place.